Running context-guru as a hosted service
One instance, one hostname, many users. Each user points their agent at it with a token we mint, gets their own dashboard, and manages their own compaction config.
Hosted mode is off unless you pass --upstreams. Without that flag this binary
behaves exactly as it always has, so existing deployments and the benchmark
harnesses in deploy/harbor/ are unaffected.
Looking for the local path? You do not need any of this.
context-guru is still a single binary you run on your own machine:
No accounts, no tenant database, no systemd, no nginx, no cold storage. Start at
Quickstart: proxy and the
Dashboard; everything on this page is the shared-box deployment
and is additive. The seam is one field — with no --upstreams the tenancy layer
is nil and the control plane is not mounted at all (/api/me 404s), which is
regression-tested rather than merely intended.
What changes when hosted mode is on
| Single-tenant | Hosted | |
|---|---|---|
| Who may call the proxy | anyone who can reach the port | a valid cg_live_… token |
| Pipeline | --config / --preset, one for the process |
the caller's own from the control database, or the server default they track |
| Compaction state store | one, shared | one per tenant |
| Upstream + credential | fixed at boot from flags/env | the tenant's chosen name from the allow-list; the caller's own provider key forwarded |
| Dashboard data | everything | scoped to the caller; a manager defaults to the whole service (?tenant=me for their own, ?tenant=<id> for one account) |
/stats |
open | loopback or a manager (it is a service-wide aggregate) |
| Transcript capture | operator's flag | operator's flag and the tenant's consent |
Credentials, and what is never stored
No secret is written anywhere it could be read back — every value in the control database is a digest of something, and none of them can be replayed as its input.
User tokens. We mint them; the database holds sha256(token) and the first 8
characters, and nothing else. After Register returns, the process no longer has the
plaintext — so there is no code path that can print one, and a dump of the control
database cannot be replayed against the proxy. Show it once, at registration.
Provider keys belong to the caller. Your agent sends its own key in
Authorization / x-api-key / x-goog-api-key, and the proxy forwards it
unchanged — your traffic, your provider account, your invoice. The service holds no
provider credential of its own: the key is read off the request and dropped.
One exception, and only if you switch it on. The idle prompt-cache keep-alive
(cache.keepalive, off by default) sends a request between your requests, when none is
in flight — so for opted-in accounts it must retain your key, and the last request's body,
for the length of the idle gap. Held in memory only, masked at rest, overwritten on
release, never logged or persisted, and bounded by a hard deadline of about 14 minutes.
Every use is a dashboard row you can audit. See
Keep an idle prompt cache warm.
Identity moves in a header of its own, x-context-guru-token, carrying the cg_live_…
token; copyHeaders strips every x-context-guru-* header before forwarding, so a token
cannot leave the box. A token presented in an auth slot instead is still accepted (some
tools have nowhere else to put it) and is scrubbed out on the way — recognisable because
only our tokens are shaped cg_live_ + 26 characters.
A caller with no credential of their own gets a 401 and never falls back to whatever key the box happens to hold.
Dashboard credentials are separate, and also only ever stored derived: an argon2id
hash of the password, sha256 of the session cookie, sha256 of the 5-minute email
code, and — for an agent that can carry no header of ours — sha256 of the provider key
it was bound with. See the sign-in flow.
Server-held keys are an explicit opt-in, not the default. An allow-list entry may
name a key_env, and then that variable's value replaces the caller's auth on
forward. That is for a gateway deployment where the agent holds only a placeholder —
eval containers, a local single-tenant proxy. Omit key_env (the hosted default) and
the caller's own credential goes through.
Operator setup
0. Prerequisites
Everything below was derived from the scripts in deploy/service/, which are the authority.
| For | You need |
|---|---|
| Building the binary | Go 1.26 — no C toolchain: the binary is pure Go and statically linked (make build-static, which CI proves needs no C compiler). Or an already-installed /usr/local/bin/context-guru-proxy, which install keeps if there is no fresh build. A C toolchain is needed only for the optional cg_skeleton tag |
| Installing | root, and systemd. The scripts are written for RHEL 9 (dnf, and nginx 1.20's config dialect) |
| The TLS front end | nginx, plus a certificate and key at /etc/context-guru/tls/{fullchain,privkey}.pem |
| Each upstream | a host to send it to. A key only if you want the server to hold one — the default forwards each caller’s own |
| Cold storage (optional) | rclone, and a browser somewhere for the one OAuth step |
| Grafana (optional) | podman or docker |
1. The upstream allow-list
Copy deploy/service/upstreams.example.yaml to /etc/context-guru/upstreams.yaml
and set the hosts. A tenant chooses an upstream by name; there is no way for a
tenant to supply a URL, which is what keeps the proxy from becoming an
unauthenticated forwarder to anything this host can reach.
The loader validates at boot and refuses to start if any named credential is missing from the environment. That is deliberate: with no key to inject, the proxy would forward the caller's own header — the token we minted — to a third party.
2. Install the service
deploy/service/install.sh is the whole deployment. It is idempotent — safe to re-run
after changing a credential, adding an upstream, or rebuilding the binary — and it has
eight subcommands:
sudo ./install.sh … |
Does |
|---|---|
preflight |
Says what is missing, and nothing else. Needs root. |
install |
User, group, directories, binary, units, drop-ins. Does not start. |
start |
preflight, then enable --now for the service and the backup timer. |
nginx |
Installs the TLS front end (needs nginx and a certificate present). |
status |
Unit state, the last 15 journal lines, the backup timer. |
grafana |
Prometheus + Grafana over /metrics, loopback only — see Grafana. |
grafana-status |
Containers, scrape health, dashboard-provisioning errors. |
grafana-remove |
Drops both containers, keeps the metrics history. |
From a bare RHEL 9 box
# 1. Build. The installer copies bin/context-guru-proxy; with no fresh build it keeps
#    whatever is already at /usr/local/bin, and with neither it refuses.
make build

# 2. Create the account, directories, binary, units and drop-ins.
sudo deploy/service/install.sh install

# 3. Real hosts. No key_env, so each caller's own provider key is forwarded and no
#    credential file is needed. (Gateway deployments only: add key_env: NAME, put the
#    key in /etc/context-guru/credentials/<name>, chmod 0400, and re-run install.)
sudoedit /etc/context-guru/upstreams.yaml

# 4. Site settings — MANAGER_EMAIL above all. This file, NOT the unit.
sudoedit /etc/systemd/system/context-guru.service.d/20-local.conf

# 5. Preflight, then start.
sudo deploy/service/install.sh start
Then the TLS front end (2b), the email path (3), a registration mode (4), and cold storage (5). Only the email path blocks a first account; none of them block a first request.
The four things worth understanding before you run it
The cg system user, and its primary group. A system account with no home and
/usr/sbin/nologin: it runs one binary and owns one directory. The installer creates the
group first, explicitly, because useradd --system without --gid falls back to the
distribution default — on RHEL that is users — and then every install -g cg in the
script fails with "invalid group" and aborts a half-finished install. Owning a dedicated
group is also what makes 0700 on /var/lib/context-guru mean only this service
rather than anyone in users. An account created before this script existed is moved
onto the right primary group by install, and preflight fails if it is wrong.
Upstreams are named, never supplied. /etc/context-guru/upstreams.yaml is the
operator's allow-list, and a tenant picks an entry by name. There is no field
anywhere that accepts a URL from a user, which is the difference between a proxy and an
unauthenticated forwarder to anything this host's network can reach. The example ships
REPLACE-WITH-… placeholder hosts and preflight fails while they are still there —
starting with them means every request 502s.
Server-held keys, when you want them, arrive by LoadCredential. The default needs
none — the caller's own provider key is forwarded — but an allow-list entry may name a
key_env, and then the value lives in
/etc/context-guru/credentials/<entry> (root-owned, 0700 directory, 0400 files) and
systemd hands it to the process as a credential rather than an Environment= line —
which systemctl show would print to anyone who can read the unit. install generates
10-credentials.conf from whatever is actually in that directory, because a hand-written
LoadCredential naming a file that does not exist fails the whole unit with an error that
does not say which file. So adding a server key is: drop it in, re-run install.
Both spellings of a name work (ibm-litellm and ibm_litellm), and preflight accepts
either.
20-local.conf is created once and never overwritten. Site settings — MANAGER_EMAIL,
REGISTER_DOMAINS, LISTEN_ADDR, the per-tenant limits, METRICS_TOKEN — live in
/etc/systemd/system/context-guru.service.d/20-local.conf. The shipped unit is
replaced on every install so a fix to it actually lands, which is exactly why nothing
a human edits may live there: settings like MANAGER_EMAIL used to be edited in the unit,
and since installing is idempotent and gets re-run to regenerate the credential drop-in,
every re-run silently reverted the operator's edits. The drop-in is the fix. After editing
it: sudo systemctl daemon-reload && sudo systemctl restart context-guru.
Preflight is a gate, not a suggestion
preflight checks the user and its group, the binary, the start wrapper, the state
directory, the allow-list and its placeholders, a credential file for every key_env
named, the credential drop-in, the effective MANAGER_EMAIL (from the unit or any
drop-in — checking only one is how "I set it and it still says empty" happens), and the
rclone config.
start runs it first and refuses to start on any failure. That is deliberate:
Restart=always plus a missing prerequisite is a crash loop that respawns every two
seconds and buries the real cause under a hundred identical journal entries. Do not
systemctl enable --now by hand to get around it.
It needs root, and not for ceremony: the credentials directory is 0700 root and the
state directory is 0700 cg, so an unprivileged run cannot stat either and reports both
as missing — a false negative in a diagnostic sends someone chasing a credential they
already installed.
2b. TLS front end
Needs a certificate at /etc/context-guru/tls/{fullchain,privkey}.pem; the installer
says so rather than letting nginx fail to start. Until TLS is up, leave LISTEN_ADDR on
loopback — every user's token crosses the network on every request, so an unencrypted
LAN listener is not an option for a service holding other people's credentials.
Two nginx settings are load-bearing rather than stylistic, and getting either wrong looks
like context-guru being broken: proxy_buffering off (the proxy streams SSE both to
agents and to the dashboard) and proxy_read_timeout 600s (agent turns and the live feed
both outlive the 60-second default).
install.sh nginx checks the certificate rather than only that two files exist: that it
parses and has not expired, that it matches the private key, that it is valid for more
than 21 days, and that fullchain.pem holds at least two certificates.
fullchain.pem must be leaf then intermediate
A fullchain.pem containing only the leaf is the classic failure, and it is miserable to
debug from the client side: a browser that cached the intermediate from another site
verifies fine, while every agent fails, because a client trusting only the root has
no way to bridge the gap. install.sh nginx says so explicitly, and the fix is a
concatenation:
There is deliberately no port-80 server block, and the installer reports it if anything
else starts listening there — a distro default server can come back with a package upgrade.
Every request carries a cg_live_ token in a header, so a 301 to https:// would arrive
after the credential was already sent in cleartext.
2c. Prove the public TLS path
deploy/service/tls-smoke.sh
checks the deployment from a client's point of view, through https://$CG_HOST and never
through 127.0.0.1:4000 — because every failure it exists to catch only appears once nginx
is in front.
CG_TOKEN=cg_live_… deploy/service/tls-smoke.sh      # authenticated checks included
deploy/service/tls-smoke.sh                          # without a token: skips those, runs the rest
CG_HOST defaults to dashboard.internal.example.com and CG_CA to
/etc/context-guru/internal-root-ca.pem; override either from the environment. Passing
the root explicitly is the point rather than a detail — it proves a client trusting only
that root can verify the server, which is the situation every managed laptop on an internal CA is in. The CA copy
lives beside the config and not in $ETC/tls/, which is 0700 root: correct for a private
key, wrong for a public root certificate that ops scripts and unprivileged clients need to
read. (Putting it there silently downgraded the script to the system trust store and turned
every check into a certificate error.)
What it asserts, and why each one is a real failure someone has shipped:
| Check | A failure means |
|---|---|
chain verifies to the root, depth=1 present |
the intermediate is not being served — works in a browser, fails for every agent |
| certificate valid > 21 days | not enough warning to get a reissue through the normal process |
| a wrong hostname is rejected | the certificate is a wildcard, or the client is not checking names |
/healthz 200 over TLS |
the front end is not reaching the proxy |
| port 80 refuses connections | a cleartext request would leak the token before any redirect |
/stats and /metrics are 403 through nginx, 200 on loopback |
a service-wide, every-tenant aggregate is public; the loopback gate stopped meaning anything once the peer became the reverse proxy |
/api/stats, /api/requests, /api/sessions are 401 without a token |
per-tenant data is public |
the cg_dash cookie carries Secure and HttpOnly |
the flag comes from X-Forwarded-Proto, so this is the check TLS termination can break |
/api/events produces bytes within 24 s |
proxy_buffering is on, and the dashboard looks simply dead |
The SSE check waits past the 20-second keepalive on purpose: on an idle service the first
bytes are the server's own : keepalive comment, and its arrival is the proof — it
originated server-side and reached the client unbuffered.
The installer does not place the root CA file
install.sh creates $ETC/tls/ and installs the nginx config, but nothing in it writes
/etc/context-guru/internal-root-ca.pem. Put it there by hand (readable, not 0700)
if you want tls-smoke.sh to test against the root rather than falling back to the
system trust store — it says which one it used.
3. Configure the email path
Nothing about accounts works until this is set. Registration mails a 6-digit code to
prove the address is real, and signing in mails one as a second factor. With no mail path
POST /api/register answers 503 naming the missing variable, and the startup banner
warns. That is deliberate: a registration whose code went nowhere is worse than one that
refuses.
All of it is read from the environment per send, so pointing at a different relay needs no restart.
| Variable | Meaning |
|---|---|
CG_SMTP_HOST |
Relay hostname. Required. Empty means no mail path. |
CG_SMTP_PORT |
Default 25. |
CG_SMTP_FROM |
Envelope and From: address. Default context-guru@<hostname>. |
CG_SMTP_HELO |
EHLO name. Default the local hostname. |
CG_SMTP_USER / CG_SMTP_PASSWORD |
SMTP AUTH, if the relay wants it. Usually empty inside a corporate network, where the relay authorises by source IP. Read at send time, never stored. |
CG_SMTP_INSECURE=1 |
Skip STARTTLS certificate verification. For a relay with an internal-CA or mismatched certificate only. |
CG_MAIL_DEV_SINK |
Development escape hatch — see the warning below. |
STARTTLS is used whenever the relay advertises it, and a failure to negotiate aborts the send rather than continuing in the clear: a code that travels plaintext because a certificate expired is exactly the silent downgrade that makes "we use TLS" untrue.
On the IBM internal network mail-relay.internal.example.com:25 accepts mail from this host, advertises
STARTTLS, verifies against the public trust store, and needs no AUTH:
Environment=CG_SMTP_HOST=mail-relay.internal.example.com
Environment=CG_SMTP_FROM=context-guru@<this-host>.internal.example.com
Egress on 465 and 587 is blocked from this network; only 25 to the internal relay is open. Do not configure a public provider — it will time out.
CG_MAIL_DEV_SINK must never be set on a real deployment
CG_MAIL_DEV_SINK=log writes the six digits to the server log at INFO, so anyone
who can read the log can complete anyone's sign-in. Any other value is treated as a
file path, appended to with mode 0600. It applies only when CG_SMTP_HOST is empty,
and every send through it logs a warning saying what it just did. It exists so a
deployment with no relay can still create its first account.
4. Choose how accounts are created
Self-registration is open by default: anyone whose address passes --register-domains
can create an account, once they enter the code mailed to it. Two things make that safe
enough to be the default — the address is now proven rather than claimed, and an account
no longer spends the operator's money (each user forwards their own provider key).
CG_REGISTER is read per request, so switching modes needs no restart.
CG_REGISTER |
POST /api/register |
|---|---|
unset / open |
Default. Self-service, capped at 3 attempts per minute per client address, plus mandatory email verification. |
invite |
Additionally requires an exact code in the request body, compared against CG_REGISTER_CODE in constant time. With no code configured it refuses rather than falling through to open. |
closed |
Refused with 403. Nothing can create an account — see the bootstrap note below. |
Anything the resolver does not recognise — a typo, Open, " open" — normalises to
open, the default, like every other setting in this project. closed and invite are
the deliberate departures, so a typo cannot silently disable accounts. The startup banner
and /api/whoami both report the mode through the same resolver the gate uses, so a log
line cannot disagree with what is enforced.
The sign-in flow
Two phases, and phase one issues no cookie — knowing a password is never by itself a signed-in browser.
| Step | Route | Result |
|---|---|---|
| Register | POST /api/register {email, password} |
account created unverified, no token, code mailed. The reply carries code_expires_at so the UI can count down against the server's clock. |
| Confirm | POST /api/verify {email, code} |
verified, first cg_live_ token returned once, session opened. |
| Sign in | POST /api/login {email, password} |
password checked, fresh code mailed. |
| Second factor | POST /api/verify {email, code} |
session opened. |
/api/verify decides which flow it is from the pending code's own purpose, never from
anything the client says — otherwise a login code could be spent on the branch that mints
a token.
- Codes are 6 digits, valid 5 minutes, one-time, and stored only as a hash. A new code replaces the pending one rather than adding to it.
- Passwords are stored as argon2id — 64 MiB, 3 passes, 2 lanes, a fresh 16-byte random salt per account — in PHC string format, so the parameters can be raised later without invalidating a single existing password. Minimum 8 characters, no composition rules: length is what buys entropy.
- Brute force. A code tolerates 5 wrong guesses, after which it is destroyed rather than merely refused. On top of that, password attempts are capped at 5/minute and code submissions at 10/minute, charged against both the email address and the client address — either bucket alone is trivially sidestepped (per-email only lets one host grind every account; per-IP only lets a botnet grind one account). Deliberately a rolling window rather than a sticky "locked for 30 minutes", which anyone could aim at a colleague by typing their address.
- Proxy tokens are unchanged, and are still how agents authenticate to the proxy. They are a separate credential: a token cannot sign in to the dashboard once the account has a password, and a dashboard session cannot send traffic. An account created before passwords existed still signs in with its token, because it has nothing else.
- Several machines at once is the expected state. Each session records a label,
User-Agent, address, and last-seen time; Settings → Signed-in machines lists them and
revokes them one at a time (
GET/DELETE /api/me/sessions/{id}).
Bootstrapping when you start closed
POST /api/register is the only route that creates an account
There is no manager-side create. A manager can reissue a token for a tenant that
already exists, set its row quota, or disable an account — but cannot bring one
into being. So a control database on closed has no path to a first account at all.
MANAGER_EMAIL has to be set before the manager registers: the role is assigned at
registration by comparing the address, which is how the first manager exists at all without
an interactive bootstrap step to forget and then work around. If you have set
CG_REGISTER=closed, open invite briefly, register, and close it again — no restart
needed, the variable is re-read per request.
How the open limit is keyed
Three attempts per minute, and the bucket is not the raw RemoteAddr:
- IPv6 is keyed on the
/64prefix. Per-address limiting is meaningless against IPv6 — the smallest allocation anyone gets is a/64, so 2^64 source addresses means 2^64 free buckets. One allocation, one budget. IPv4 is keyed on the exact address. X-Forwarded-Foris trusted from a loopback peer only. A remote caller cannot makeRemoteAddrloopback, so for it the header is ignored entirely and the bucket is its own address — honouring a remote client's header would hand it a fresh bucket per request. A loopback peer is the reverse proxy on this host, and ignoring the header there put every client of the real deployment into one bucket: a registration denial-of-service for legitimate users at 3/min service-wide, and no per-attacker control at all. nginx uses$proxy_add_x_forwarded_for, which appends the peer it saw, so the last element is the one our own proxy wrote and the earlier ones are client-supplied noise.
Residual: a process on this host can forge the header and get unlimited buckets. Anything with local access can already read the control database, so that is not the boundary this defends.
--register-domains example.com narrows which addresses may register, in any mode. It is an
exact-domain-or-subdomain match on the part after the @ (example.com and
x.example.com pass; notexample.com does not).
What these modes do not do. The address is now proven — a code has to arrive in that
mailbox — but reachability is not entitlement. Anyone with a real mailbox in an allowed
domain can register, and can register more than once with more than one address; the rate
limit only slows a single source. What that costs is not the operator's money — every
account spends its own provider credential — but accounts on your box, consuming its CPU
and its row quota (--dashboard-max-rows-per-tenant). An invite code is a shared secret
with no per-use accounting: once it leaks it is open until you rotate it. A port the whole
internet can reach wants invite.
5. Cold storage on Box
deploy/service/box-setup.sh check     # what is installed and configured
deploy/service/box-setup.sh install   # rclone (falls back to a user-local install)
deploy/service/box-setup.sh token     # prints the browser step, which cannot be automated
deploy/service/box-setup.sh paste     # write a token obtained elsewhere, from stdin
deploy/service/box-setup.sh verify    # write, read back, compare, delete
deploy/service/box-setup.sh park FILE # move ONE retained artefact to Box, by hand
The OAuth step needs a browser and this host is headless, so token prints two exact
routes: authorize on your own machine with rclone authorize "box" --client-id ""
--client-secret "" and paste the JSON here, or forward port 53682 and let the server
run the flow. Everything else the script does itself.
Run box-setup.sh as your own user, before the installer. It writes
~/.config/rclone/rclone.conf, and install.sh install copies that file to
/var/lib/context-guru/rclone.conf (mode 0600, owned by cg) — so the order is
box-setup, then install. An existing /var/lib/context-guru/rclone.conf is left alone;
set RCLONE_SRC= to copy from somewhere else. Without it, preflight warns rather than
fails, and the service runs with cold storage disabled — which means eviction deletes
instead of archiving.
The nightly control-database backup needs no separate step: install lays down
context-guru-backup.{service,timer} and its script, and start enables the timer
alongside the service. install.sh status shows when it last ran and when it runs next.
park is for retained artefacts — a pruned copy of the metrics database, a pre-deploy
snapshot, an old backup — and it is deliberately manual: it prints what it is about to do,
asks, uploads with rclone copyto, stats the object back and compares its SIZE, and only then
removes the local file. Nothing schedules it, and it refuses a live database (cg.db,
cg-control.db, or any file with a -wal beside it) — a live SQLite file has commits in its
write-ahead log that the main file does not, so parking it would upload a torn copy and delete
the complete one. Whether an artefact is still needed is a judgement call, which is exactly why
this is a command an operator runs and not a rule the service applies.
The metrics database itself does not need cold storage. Its bulk was duplicated prompt
text — the same tool schema stored once per session that declared it — and that is now stored
once (declaration_text, see the dashboard's tables). Session archival to Box
is still there for history you want off local disk; there is nothing to build for size.
Deploying somewhere that is not IBM
The procedure above is the whole deployment anywhere; four things are IBM-specific, and each one is a decision rather than a line to copy.
The certificate authority. The IBM deployment's certificate comes from the IBM Internal
Intermediate CA, which every IBM-managed machine already trusts — so for its users there is
nothing to install. Off that network you have three options, and only one of them is not a
support burden: a publicly trusted certificate (Let's Encrypt or an ACME CA, with renewal
automated), your own internal CA (every client machine, container and CI runner then needs
that root in its trust store, which is the failure users hit first), or a self-signed
certificate, which install.sh nginx will print a one-liner for and which is a test
convenience, not a deployment. Whatever you pick, fullchain.pem must still carry the
intermediate, and tls-smoke.sh with CG_HOST and CG_CA set is still the check.
The firewall exception. The IBM deployment is reachable from the corporate network only, with an
inbound exception for TCP/443 and nothing else. Port 80 is not requested and
not served. Reproduce both properties: a public deployment that opens 80
"for the redirect" leaks a token per mistyped URL. Keep LISTEN_ADDR on loopback so the only
way in is through the TLS front end.
Registration policy. REGISTER_DOMAINS=example.com in the shipped drop-in is what makes
open mode tolerable there: an attacker needs a real, reachable mailbox in a domain you
control, since registration mails a code to it. With no
domain restriction, open means anyone with any working mailbox can mint an account on
your box, and the only brakes are the mailed code and 3 attempts/minute per client
address. A publicly reachable deployment wants invite with a code you rotate, or
closed with accounts you create yourself.
No spend caps, and none needed. Every tenant's traffic is billed to the credential
that tenant's agent sends, so there is no shared budget to guard. Month-to-date cost is
still computed and shown, per tenant, on Settings and in the manager's roster — it needs
MODEL_INFO on to be non-zero, because an unpriced row costs $0.00.
Set MODEL_PRICES if you're behind an internal LLM gateway. A gateway can bill a fraction
of a provider's published rates, or serve model ids the public price map has never heard of —
either way, cost shows as $0.00 until you point at a price list that matches what your gateway
actually charges. Fix it by pointing at the shipped list:
sudo install -m0644 deploy/service/prices.example.yaml /etc/context-guru/prices.yaml
sudo systemctl edit context-guru          # or a drop-in file:
#   [Service]
#   Environment=MODEL_PRICES=/etc/context-guru/prices.yaml
sudo systemctl restart context-guru
journalctl -u context-guru -n 20 | grep "price list"   # "entries=42"
A malformed file refuses to start rather than falling back, because a price list that silently failed to load is indistinguishable from "every model is free". The file holds list prices and no credential. Details and the matching rules: Per-model prices.
Two things that are environment-agnostic and should not be relaxed regardless of where you
deploy: cold storage on Box is one rclone remote name away from being any other remote, and
/metrics plus Grafana binding loopback-only is about cross-tenant spend data.
User setup
Are you a user of an internal hosted deployment, not its operator?
Ask your operator for their connect guide — it is the five-minute version of this section: register, trust the CA, point one agent at it, and turn it on and off per session.
Keep your own provider key where it already is. The proxy forwards it, so your
traffic is billed to you. What you add is a base URL and the context-guru token, and the
token goes in x-context-guru-token — never in the slot your key occupies.
# Claude Code — your own key stays in ANTHROPIC_API_KEY (or ANTHROPIC_AUTH_TOKEN)
export ANTHROPIC_BASE_URL=https://cg.<host>/anthropic
export ANTHROPIC_CUSTOM_HEADERS="x-context-guru-token: cg_live_xxxxxxxx"

# OpenAI-dialect tools — your own key stays in OPENAI_API_KEY; send the header
#   x-context-guru-token: cg_live_xxxxxxxx
export OPENAI_BASE_URL=https://cg.<host>/openai/v1

# Bob — its client sets every header itself and cannot carry ours, so bind the key
# it already sends, once, on the Settings tab: Bound agent keys → paste → Bind.
# Stored as sha256 only, never in plaintext.
export BOB_GATEWAY_URL=https://cg.<host>   # bobshell 2.x; older builds: CUSTOM_BASE_URL
Choosing which gateway your traffic goes to
Each account picks its upstream by name on its Settings page, one dropdown per dialect, from the operator's allow-list. Where a deployment lists two hostnames for the same gateway — an internal and an external one — that dropdown is how a laptop that can only reach one of them gets pointed at it. No account can supply a URL; that would make the proxy an unauthenticated forwarder to anything this host can reach.
New accounts start on the first entry of their dialect, which is an accident of file order once there is more than one. Name the default explicitly instead:
CG_DEFAULT_OPENAI_UPSTREAM and CG_DEFAULT_BOB_UPSTREAM do the same for the other dialects.
An unknown name warns at startup and is ignored — the allow-list is the authority on what
exists, and a typo in an optional default must not stop the service. Changing the default
never moves an existing account.
How each agent identifies itself
| Agent | Mechanism | Why |
|---|---|---|
| Claude Code | ANTHROPIC_CUSTOM_HEADERS="x-context-guru-token: …" (or the same pair in ~/.claude/settings.json env) |
Documented Name: Value, newline-separated for several. Leaves ANTHROPIC_API_KEY / ANTHROPIC_AUTH_TOKEN free for your own key. |
| OpenAI-dialect tools | x-context-guru-token header, however your tool sets extra headers |
Same slot rule; OPENAI_API_KEY stays yours. |
| Bob (BobShell) | sha256 of its own API key (BOB_API_KEY, or the legacy BOBSHELL_API_KEY it aliases), bound once from Settings → Bound agent keys — POST /api/me/agent-key under the hood. An API key, not SSO: an SSO bearer is reissued each login, so its digest is not an identity. |
Bob's client builds Content-Type, User-Agent, Authorization, x-instance-id and x-team-id itself and exposes no hook for another header; its headers setting applies to MCP servers only. So it is recognised by the credential it already sends. |
Binding a key: two refusals. A key under 20 characters is refused 400 — identity here
is the key's digest, so a guessable key would be a guessable account. A digest already
bound to another account is refused 403 and never moved: binding a digest someone else had
bound used to transfer their traffic, and with capture_content on their captured
transcripts, to whoever bound it. Its owner unbinds first, then the new holder binds.
The floor is enforced on bind and deliberately not on resolve, which matters when
upgrading an install that already holds bindings. A stored row is a digest with no length
attached and no plaintext behind it, so a short key bound before the floor existed cannot be
audited — nothing can find it or measure it — and it keeps identifying its account. Enforcing
the floor at resolve time instead would be worse than leaving it: the check would have to run
against every arriving key, and the first short one would stop identifying an account that had
been working, breaking a tenant's agent to fix a weakness in their choice of key with no
warning and no way for them to see why. So the asymmetry is the intended trade — new bindings
are held to the floor, existing ones keep working. The one-way consequence is worth knowing
before you reach for it: unbinding is the only way to clear such a row, and once cleared the
same short key cannot be bound again, because a fresh bind now hits the 400. On a database
with no bindings yet, none of this arises.
Agent family (claude-code / bob / codex / …) is read from the User-Agent, which none
of this touches.
The path carries the dialect; the tenant's configuration carries which upstream each dialect goes to. So switching between Claude Code and Bob needs no per-agent choice of gateway, and the same token works in all of them.
Verify the traffic actually arrives — an export is not proof
For Claude Code, an env block in ~/.claude/settings.json overrides the variable
you exported, and the override is silent: Claude Code answers normally, nothing
errors, and the only symptom is an empty dashboard and no savings, because nothing
ever reached the service. This has already caught us once on this very deployment.
After setting the variables, confirm your own dashboard's request count moves. If it stays at zero, read Use with Claude Code — it has the two-command diagnosis and both fixes.
Escape hatches, worth knowing before you need them: unset the base URL to bypass
the proxy entirely, or send x-context-guru-bypass: true to keep the metrics without
the compaction.
Default configuration
Every new tenant starts on house — the structural offloaders with no model call
anywhere in the path:
pipeline: [format, dedup, toon, cmdfilter, searchfold, textclean, extract, cachesplit, toolfilter]
components:
  extract:
    min_tokens: 400
mode: sync
housellm is the same pipeline with extract_llm inserted before extract, applied
per account on request, plus extract_llm_sweep after it. They do not share a model, a trigger, or
a mechanism, and the differences are the point rather than tuning.
extract_llm reduces individual tool outputs in the uncached tail, where a removed token is
being written into the cache at 1.25x fresh. It calls a cheap model (claude-haiku-4-5, on the
caller's own credential and endpoint) when the economic gate says the expected saving beats the
priced cost of the call, and it rewrites an output — a model-written program trims it down.
extract_llm_sweep adjudicates instead of rewriting, and asks a different model in a different
way. It fires in the window just before the prompt cache expires, and asks the request's own
model — over the transcript that model already holds in its cache, which is what makes the
question affordable — which outputs are spent, in one call covering every candidate. It never
sends the outputs: the ask carries an inventory (label, size, tool-call id, first line), and the
model answers with a verdict per label. A spent output is removed whole and replaced by a short
shape descriptor plus a marker, so expand still recovers it; nothing is rewritten, so nothing can
be invented. Candidates are the entire transcript, not the tail: the sweep accepts invalidating
the prefix, which is what the window buys — inside it the prefix has at most the window's width left
to live. The economic gate does not apply, because its arithmetic prices a per-output cheap-model
call and this is neither.
It declines below a minimum inventory (10 by default), because the model's judgement is a function of how many candidates it compares: shown one output it scores inside the drop-everything null model's error bar, and at ten it cleared 100% of genuinely-spent candidates in probes. Below the floor a removal would be a guess, and a wrong removal costs content the agent still needs.
Both are offered by name rather than turned on for everyone, because those calls spend the caller's money.
Changed 2026-08-23: searchfold and toolfilter joined the default, and dedup moved
ahead of toon. toolfilter ships with an empty removal list, so it is a no-op until an
account names a tool, MCP server or skill to stop sending — it is in the default so that
naming one is a settings change rather than a pipeline change. toon stays in this order at
the operator's request even though it acted 0 times on 5,752 measured requests; it is
lossless, so what it costs is latency, never content. linecap is not here. Its 20.3% is
gross reach, not incremental value: measured on the same corpus, adding it to this pipeline is
worth +0.797 pp (+152,615 tokens), because the offloaders ahead of it have already taken most
of what it would have caught.
textclean was added on 2026-08-20 and is the reason to re-read this section if you last
saw it earlier. It strips ANSI escapes and carriage-return redraws from tool output, which
is display noise your agent never saw rendered — so it is lossless, needs no marker, no
stash and no minimum size, and is a pure function of the content, meaning it produces the
same bytes on every turn and never invalidates your prompt cache. It exists because
format and toon only understand JSON, and 1,724 of 1,748 distinct tool outputs measured
on this service are not JSON. Measured saving on that corpus: −17,219 tokens, 1.73%, at zero
upstream spend.
Whether this reached you depends on one thing: an account with an EMPTY config tracks
the server default and picked this up at the restart, with nothing to do. An account that
has ever saved its own config on the settings page keeps exactly what it saved — including a
config that happens to be identical to the old default. That is deliberate (a saved config
is a choice, and this service does not rewrite choices), but it does mean the upgrade is not
automatic for everyone. To take it: either add textclean to your own pipeline after
toon, or press Track the server default, which hands you this document and every
future improvement to it.
failed_run used to be in that list and is not any more. It acted zero times on every
workload measured here — 251 requests on one account (843 ms spent scanning), and 28.8 s on
the Terminal-Bench arm — so it was latency with a name. It is still a registered component
and can be added back on the settings page by anyone whose traffic actually re-sends
superseded failures.
Fully deterministic, which is the property that matters on a shared box: no cheap-model calls, so it adds no upstream spend, contends for no shared LLM budget, and puts near-zero latency on anyone else's agent turn.
Turning on the compaction model (extract_llm)
Off for everyone by default, and it stays off after a deploy — nothing below happens unless an account opts in. It is the only component that spends money to save money, and its two halves have opposite economics, so they are separate switches.
Settings → Compaction model calls (extract_llm) on the account's own page (manager-only, because the server refuses a configuration from anyone else). Each control states what it costs.
The settings page has no YAML box
It had one, and it was the cause of the failure it was supposed to be the escape hatch from.
The page built the document by rewriting the pipeline: line with a regular expression in the
browser, which produced this on a config whose pipeline was written as a block sequence:
The refusal left the old document stored, so the next attempt mangled the same input again —
two accounts were stuck in that loop on every save. A preset: document lost its entire
pipeline the same way, silently, because there was no flow-style line to read the existing
names out of.
So the page posts fields (config on PUT /api/me) and the server applies them to the
account's document with a real YAML library, validates the result by building it, and stores
it only then. Keys the form does not own — model:, strategy, marker_mode, another
component's block — survive the round trip untouched. What is not preserved is comments and
key order: a map has neither, and that is the trade for never emitting a broken document.
Anything the fields do not cover is set by a manager through Accounts → the account → Full configuration (YAML), which still takes a document and still validates it strictly. The settings page shows that whole document read-only under Full configuration, so "what am I actually running" is a fact on the page rather than an inference from the fields.
Response-header timeout, not a body timeout
ResponseHeaderTimeout bounds time to the FIRST byte, so a dead upstream is still caught
while a stream that is producing tokens is never interrupted for having produced them for a
while. --upstream-header-timeout / UPSTREAM_HEADER_TIMEOUT tunes it (default 10m). That
default is generous because a NON-streaming request sends its headers only once it is
generated, so for that shape it is still the whole budget.
If you suspect this on a long streamed turn, check upstream_ms on the request row against
cg_latency_ms: the former is time spent waiting on the upstream, the latter is
context-guru's own processing time, and they are not close on a healthy request.
Two fields decide whether extract_llm can act at all
model.source—configselects an operator-configured compaction model, and this service deliberately has none: it will not spend the operator's credential on a tenant's traffic. Soconfighere means the component has no model and silently never calls anything.incominguses the caller's own model and key. The settings page now says this in the field's own hint, driven bycompaction_modelfromGET /api/options.model.model— the model that does the compacting, on the same endpoint and credential. Leave it empty and the work runs on your agent's own frontier model, which does not pay off: a cheap model such asclaude-haiku-4-5is the recommended value and is what the form pre-fills.allow_on_caching_backend— absent means false, and the economic gate then hard-declines every candidate whose tokens are already prompt-cached. On Claude Code against Anthropic that is the whole workload. The cold-cache sweep is not subject to it, which is why the sweep is the recommended way in.
Both are switches on the settings page now, alongside strategy,
llm_every_n_requests and trigger.min_request_tokens — the other keys real stored
documents already carried and the form could not show.
Start with the cold-cache sweep alone. This is the half whose economics are not in doubt: turns that resume after the provider's cache TTL are ~4% of this deployment's requests and ~31% of its spend, they re-bill the whole transcript at 1.25x the fresh rate, and today nothing touches them.
- Tick "Sweep the transcript when the prompt cache has expired".
- Leave "Also reduce large tool outputs as they arrive" unticked.
- Save. The page warns that saving discards frozen compaction decisions, so the next turn is not cache-warm — expected, once.
Equivalent YAML, for the server default (--config) or a manager setting it on someone
else's account through the account editor — the settings page itself has no YAML box any
more, see below:
pipeline: [format, dedup, toon, cmdfilter, searchfold, textclean, extract_llm_sweep, extract, cachesplit, toolfilter]
components:
  extract_llm_sweep:
    min_tokens: 1000
The cold sweep is its own component, so asking for it means naming it in the pipeline — there is no
enabled key. Leaving extract_llm out is how you get the sweep without the warm/tail pass, which
is what per_output: false used to mean.
Then check what it did, before turning on anything else. Requests tab → open a request →
Compaction model calls: one row per call with its cost, its saving, its latency, whether
the result was accepted, and why not when it was not. The Preset steps tab (Components) now carries an
LLM cost column and states the verdict in dollars. What to look for:
| reading | meaning |
|---|---|
net positive on cold rows |
it is paying; consider the per-output half next |
underwater $x |
the calls cost more than the tokens they removed were worth |
rejected by the acceptance check |
the model compacted but the result was refused |
reply truncated at the output cap |
raise the reply budget, or the call is wasted |
| latency several seconds per call | the agent's turn wears that; bound it with the caps |
Only then consider the per-output half, and set the caps first: a size threshold
(min_tokens), a per-turn cap, and a per-session cap. Ticking it makes the size threshold the
whole trigger, which also demotes the economic gate and the caching-backend guard to
advisory — they still record what they would have refused, visible as
economic_gate_advisory, but they no longer block. On measured warm traffic that path ranged
from break-even to net negative even when it reduced a 26k-token output by 99.6%, because a
token removed from a warm cached prefix saves only the cache-read rate.
To turn either half off again, untick it and save; unticking both removes the component from the pipeline entirely.
Tenants TRACK the default; they are not stamped with a copy of it
Register does not copy the default into the new tenant's row. An empty stored
configuration means "follow the server default", and it is resolved live on every request
by the same Registry.Config the settings page reads — so when the operator improves the
default, every tracking account is running the new one on its next turn.
Tracking is not a flag. It is the absence of a stored document, which makes both
transitions one write and keeps the settings page and the proxy from ever disagreeing about
who is following what. The account view (/api/me, /api/whoami, /api/tenants, …) carries
three fields — see
the tenant view's configuration fields
for the exact shapes:
| Field | Tracking the default | Own configuration |
|---|---|---|
config_yaml — what is stored |
"" |
the tenant's document |
effective_config_yaml — what their traffic runs |
the server default | the same document |
config_inherited |
true |
false |
config_yaml changed meaning with this: it is now the stored value, not the resolved
one. It is also the only field a settings save writes back, so a round trip through the form
cannot silently turn tracking into a frozen copy of today's default.
Who may change it. The compaction configuration — pipeline, mode, per-component
settings — belongs to the manager, per account, and is edited from the Tenants tab.
A plain account's Settings page shows its own upstreams, capture consent, spend and tokens,
and says Your manager sets the compaction; PUT /api/me answers 403 to a config_yaml
from a non-manager, so hiding the grid is not the only thing stopping it. The states below
are what the manager sees, on their own page and in each account's editor.
What Settings shows in each state. The controls always render the effective document, because drawing the empty stored one would read as "my configuration is gone":
| State | Settings shows |
|---|---|
| Tracking | Following the server default. The pipeline, mode and compaction fields are shown read-only, labelled as the operator's, with a note that they change when the operator changes the default. One button: Customise. |
| Own configuration | Using your own configuration, plus the warning that changes to the server default do not reach you — and, when the stored document is byte-identical to the current default, that it is identical. Controls editable. One button: Follow the server default (confirmed, audited). |
Moving between them: Customise stores the current effective document as your own, so nothing changes at the moment you take ownership; Follow the server default clears the stored document. Saving upstreams or capture consent while tracking leaves the configuration alone, deliberately.
Customising opts you out of improvements to the default
A tenant with a stored configuration stops receiving changes to the server default
until they choose to follow it again. That is the trade, and it is the reason the old
behaviour was a bug rather than a preference: Register used to stamp every new row with
a copy of the default, which froze every account on the default as it existed on its
registration day — adding a component to the default reached nobody who had already
registered, and there was no way to ask for "just follow it".
Rows the old Register stamped are not migrated, deliberately. Clearing a stored
config safely would mean recognising a byte-identical previous default, and none were
ever recorded — no constant, no schema row. A guess that misses does nothing; a guess
that hits deletes a configuration somebody chose. Those accounts keep exactly what they
have, and Follow the server default is the one-click, audited way out.
A tenant can enable extract_llm on their settings page. It is a real tradeoff, not
a free upgrade — measured at +117 ms per request, up to ~945 ms when file reads are
frequent — and its model calls go out on that tenant's own credential, the same one
the request carries. With no caller credential available the component skips (fail
open); it never borrows the server's.
Managing users
A manager sees every account's metrics, configuration and transcripts. Pointing the dashboard's account selector at a tenant gives a manager that tenant's own request drawer and compaction-diff view, over whatever that tenant consented to capture.
The one thing a manager never gets is a tenant's password — see Passwords.
The Tenants tab is the console. Per account it offers the full configuration (pipeline, per-component settings, mode, upstreams, row quota, capture consent, role), an A/B variant label, disable/enable with a reason, a reissued token, a password reset it cannot complete, and — behind a disclosure — purge and delete.
Editing somebody else's configuration
PATCH /api/tenants/{id} writes the fields a tenant can write for themselves (label,
upstreams, capture_content), plus the manager-only ones (config_yaml, role, max_rows,
disabled, disabled_reason, variant). This is the only way a compaction
configuration changes for somebody who is not a manager.
config_yaml goes through the same strict loader the proxy builds with, so a typo is a
400 naming the offending key rather than a surprise at request time, and a rejected
document leaves the stored one untouched.
Two behaviours to know:
- Saving the form does not end an account's tracking of the server default. While
config_inheritedis true the editor omitsconfig_yamlunless the YAML was actually edited — otherwise every save would freeze a copy of today's default onto an account that had asked to follow it. - Saving rebuilds that tenant's pipeline, which discards their frozen compaction decisions. Their next turn is not cache-warm. That cost is real and it is theirs, so it is stated on the form.
Config resolution still fails open: an account whose stored document somehow does not build is forwarded uncompacted (logged loudly), never refused.
Roles, and the door that must not close
role on the same PATCH promotes a user to manager or demotes them; the change is audited
with the actor. The promoted account has manager scope on its next request — the registry
cache is cleared on every write, so nothing has to be re-signed-in.
The last manager cannot be demoted or disabled — a 400 whose message says so:
only a manager can hand the role out, so the dashboard would have nobody left who can, and
the database would be the only way back. Promote a second manager first. Disabled managers do
not count as a way back — they cannot sign in.
A/B testing
A variant is a name a manager puts on a set of accounts. It selects nothing and changes
nothing on the request path — the configuration each account runs is still the one on its own
row — so assigning one can never break an agent. What it buys is a dimension to group by:
GET /api/variants folds each account's existing aggregates into one row per variant, with
the per-component acted/reverted/saved breakdown underneath.
The smallest thing that works, deliberately. There is no variant column on the metrics table: adding one would mean a schema bump, and in this project that renames the whole metrics database aside and starts fresh — a label a manager can change at any time has no business costing anyone their history. The fold is a sum of sums.
What the comparison cannot show, and why there is no p-value
The panel reports directional figures with their denominators, and refuses to go further. There is no significance test because the inputs do not support one:
- Assignment is not randomised. A manager chose who is in each variant, so a difference may be a difference between the people.
- Workloads are not held constant — agent, model, task mix, and how much anyone worked this week.
- Per-request cost is not per-task cost. An earlier study in this repo was misled exactly here: two arms with the same reward differed in step count, so the arm with cheaper requests spent more overall. Nothing in the dashboard can see task outcomes.
incomplete_rowscounts requests the provider gave no usage for. Where that approaches the request count, that row's money figures are unknown, not low.saved_usdis a counterfactual — what the same traffic was priced at uncompacted, minus what it actually cost including context-guru's own model spend.- The variant is read as it is today and applied to the whole window, so moving an account between variants retro-labels its past traffic. The audit log records when that happened; the panel cannot.
Every one of those is served with the data (caveats in the payload) rather than kept in
this document, so the numbers and their limits cannot be quoted apart.
Disable, with a reason
disabled refuses that account everywhere: 403 on the request path, 403 at sign-in, and
its dashboard sessions are ended. disabled_reason is the manager's note, and it is
returned to the account's owner in both refusals — without it, "disabled" is
indistinguishable from the proxy being broken to the person whose work just stopped.
Re-enabling clears the note, because a stale reason on a live account is the next thing
somebody acts on.
Purge and delete, across both databases
The control database and the metrics database are separate files with no foreign key between them, so deleting an account row does not touch that tenant's traffic. Both operations therefore run in a deliberate order:
| Step | Purge | Delete |
|---|---|---|
| 1. Cold-storage objects for their archived sessions | deleted | deleted |
2. archived_sessions index rows |
deleted, only for objects that actually went | same |
3. request_content, request_components, requests, tenant_spend |
deleted | same |
| 4. The account row, its tokens, sessions, agent keys, pending codes | kept | deleted (cascade) |
| 5. A second sweep of the metrics database | — | yes |
Why in that order:
- Objects before the index.
archived_sessionsis the only record of what is in the bucket, so removing it first would orphan the objects permanently — still costing storage, no longer findable. An index row whose object could not be deleted is kept, and the call answers502with the paths, so a retry can find them. - Data before the account. A failure is then a
502with the account intact and the operation retryable. Deleting the account first would leave rows owned by an id nothing answers to: invisible in every view and unreachable by any retry. - The second sweep exists because capture is asynchronous (a 250 ms flush). A request in flight during step 3 can land moments later; after step 4 nothing can authenticate as that tenant, so that pass is final.
- Child rows are deleted explicitly as well as by
ON DELETE CASCADE, because whether orphans are left should not depend on a per-connection pragma.
Both require the tenant's email or id typed back ({"confirm": "…"}); the UI keeps the
buttons inert until it matches, and both write an audit row. The audit trail of a deletion
outlives the account — tenant_config_audit deliberately has no foreign key on its
target.
Passwords: what a manager can and cannot do
| Action | Who | Effect |
|---|---|---|
POST /api/me/password |
the account's owner | Requires the current password even though the caller holds a session, because a stolen cookie must not become permanent ownership. Signs out every other machine. |
POST /api/password-reset → /verify |
anyone with the mailbox | Self-service recovery. Phase one answers identically for an unknown address; phase two spends the code plus the new password and ends every session. Opens no session: signing in still wants the password and a fresh code. |
POST /api/tenants/{id}/password-reset |
a manager | Mails that account a code. The manager never sees it and cannot set a password; the old password keeps working until its owner finishes. Audited. |
A manager who could set a password could sign in AS that user — sending requests on their credential, reading their mail-bound recovery, acting in their name. That is the boundary this service still promises, so the recovery path a manager gets is "start it", never "do it".
Storage
Three tiers, and the split is the design.
cg-control.db — local, permanent, backed up. Tenants, tokens, per-tenant
configuration, the audit log. Real forward migrations (PRAGMA user_version), never
rebuilt, never evicted. It stays a few MB and is the only file whose loss is
unrecoverable, so it is the only file that gets a nightly backup.
cg.db — local, hot, derived. The request metrics the dashboard queries. A row is
well under a kilobyte, so millions of requests fit comfortably; it is rebuilt on a
schema change and archived under pressure. Kept local because it must be fast and
transactional.
Box — cold, effectively unlimited. Whole sessions as single gzipped JSONL objects, written once and read rarely.
archive/<tenant>/<yyyy>/<mm>/<session>.full.jsonl.gz      whole session
archive/<tenant>/<yyyy>/<mm>/<session>.content.jsonl.gz   transcripts only
backup/cg-control-<stamp>.db.gz                           nightly control snapshot
Why rclone as a subprocess and not a mount
The obvious move is rclone mount box: ~/mnt/box, point DASHBOARD_DB at it, and get
unlimited space for free. Do not do this, and the code deliberately makes it awkward
to.
SQLite requires POSIX byte-range locking and an fsync that means something. A
FUSE-over-HTTPS layer provides neither, and rclone's own mount documentation
excludes database files for that reason. The failure mode is not slow queries, it is
silent corruption. Separately, every page read would become an HTTPS round trip, so a
dashboard query touching a few thousand pages would take minutes, and SQLite's WAL
checkpointing would run straight into Box's API rate limits.
So dash.Rclone shells out to rclone rcat / cat / lsjson / deletefile for
whole objects. No FUSE, no mount unit, no fuse package, one object per session rather
than per request, and rclone owns the OAuth token — including refreshing it — so this
process never holds a Box credential.
Eviction is migration, not deletion
This is what makes the LRU stop being destructive. With ARCHIVE_REMOTE set, every
path that used to delete a session now uploads it first:
- Export the session to gzipped JSONL.
- Upload it.
- Stat it and compare the size.
- Only then delete the local rows.
Step 3 is not ceremony. A Put that returns success is not proof: a truncated upload,
a proxy that swallowed the body, a remote that accepted and dropped it all look like
success from the writer's side. A failed or short upload leaves the local copy exactly
where it was, and the next pass retries — so the worst case is that disk was not
reclaimed, never that history is gone.
Three triggers, in order:
| Trigger | Default | What moves |
|---|---|---|
--archive-content-after |
24h idle | transcripts only; metrics stay locally queryable |
--archive-session-after |
30d idle | the whole session |
| disk watermark | 0.90 → 0.85 | oldest whole sessions, as a backstop |
Content goes first because it is where the bytes are — capped at 16 KB per message
across many messages per request, against well under a kilobyte of metrics. Moving it
early is what keeps cg.db small enough that the disk rule never fires at all,
which is the point: the watermark is now a backstop for a Box outage, not the normal
mechanism.
The archiver runs on its own goroutine, never the writer's. An rclone round trip takes seconds, and the writer owes the request path a fast insert — a blocked writer means a full queue means dropped events, which is observability failing exactly when the system is busy.
When Box is down
Archiving fails soft: the local copy stays, a warning is logged, the next pass retries.
If the remote is down and the disk fills, there is a genuine conflict, and the
default resolves it toward keeping the service up: the session is deleted and an
ERROR is logged saying plainly that the history is lost. A full filesystem takes down
every user's agent, which is worse than losing old metrics.
--archive-required inverts that — nothing is deleted without a confirmed archive, and
the filesystem is allowed to fill instead. Pick it deliberately.
Browsing archived history
The archive index is local and permanent (archived_sessions, one small row per
session). So the Sessions view lists a user's whole history, archived parts included,
instantly and even while Box is unreachable. Only opening a specific archived session
costs a round trip.
GET /api/archive lists the index; GET /api/archive/{session} fetches one back.
Fetching is read-only — it does not reinsert the rows, because dragging a session
back into the hot tier would re-trigger the eviction that put it there. A request whose
transcripts are archived reports content_archived: true and fetches them inline for
that one request, under a timeout.
An unreachable remote returns 503, distinct from 404 for "never archived". Those
mean very different things to whoever is looking, and conflating them makes a Box
outage look like data loss.
Restoring the control database
systemctl stop context-guru
rclone cat box:context-guru/backup/cg-control-<stamp>.db.gz \
  | gunzip > /var/lib/context-guru/cg-control.db
chown cg:cg /var/lib/context-guru/cg-control.db
systemctl start context-guru
The backup uses sqlite3 .backup, not cp: copying a live SQLite file while the
service writes to it yields a torn snapshot that may not open at all. It also opens the
snapshot and counts the tenants before uploading, because a backup verified only at
restore time is a backup nobody has verified.
Grafana
The proxy exposes Prometheus text at /metrics. No client library is involved — see
proxy/promexport.go for why a dependency tree was not worth taking to serialise a few
dozen series we already compute.
cg_* will not equal the dashboard, and that is correct
Two families are served, and a panel beside the dashboard invites exactly the wrong
comparison. cg_* is the in-memory aggregator — the same snapshot /stats reports —
counted in this process since it started and summed over every tenant, so it
restarts from 0 with the process (rate() handles that). cg_tenant_* is
database-backed and tenant-scoped, cached for just under a scrape interval.
So the two legitimately disagree: observed live, /metrics read 24 requests / 28,644
tokens-before while the dashboard read 26 / 28,656 — a restart and a tenant scope, not a
counting error. Use cg_tenant_* for the persistent, per-tenant numbers. Every
in-process series now carries this caveat in its own HELP text, because HELP travels into
every scraper, explorer and panel tooltip, and a note only in the docs is a note the
person reading the panel never sees. See
Routes.
Four cg_tenant_* names end in _total and are gauges
cg_tenant_requests_total, cg_tenant_tokens_total,
cg_tenant_saved_tokens_unique_total and cg_tenant_billed_tokens_total are
month-to-date: they reset on the first and they fall mid-month as rows migrate to
cold storage. rate() and increase() both read a fall as a counter reset and
extrapolate a spike where the value went down, so those series are declared gauge
and no shipped panel wraps them — Requests per tenant, month to date plots the
cumulative value, and fleet-wide requests per minute comes off the in-process
cg_requests_total, which is a real counter.
The installer brings up Prometheus and Grafana beside the proxy, provisioned, in two commands:
sudo deploy/service/install.sh grafana          # all five containers, config, dashboards
sudo deploy/service/install.sh grafana-status   # scrape health + provisioning errors
# then, signed in as a MANAGER at /dashboard/:
#   https://<the host>/grafana/d/context-guru/context-guru
#   https://<the host>/grafana/d/context-guru-host/context-guru-host   # the box itself
# or without the front end:
ssh -L 3000:127.0.0.1:3000 <the host>
# then http://127.0.0.1:3000/grafana/d/context-guru/context-guru
The front end publishes Grafana at /grafana/ behind an nginx auth_request that only a
context-guru manager's browser session satisfies — Grafana never sees a request that
fails it, not even to show its login page. That gate is also the sign-in: it names the
manager in a header Grafana's auth-proxy trusts from the loopback peer only, so a manager
lands in Grafana as an Admin with no second password to hold. Prometheus (9090) and Loki
(3100) are not published at all.
Containers rather than packages because Prometheus is in no RHEL 9 repository, so the alternative is a packaged Grafana beside a tarball Prometheus with two unrelated sets of paths to keep straight. Either podman or docker is used, whichever is present.
Both bind loopback only, which is why the ssh -L line is part of the procedure and
not a suggestion: /metrics is a service-wide view carrying every tenant's spend, and
Grafana's session cookie is as good as its admin password. Neither belongs on a shared
box's LAN interface. The built-in admin account is break-glass only — a first install
seeds it with a random value that is neither printed nor saved, because Grafana's default
when it is unset is admin/admin; set one yourself if you want that door, with the one
command in deploy/grafana/README.md. grafana-remove drops the containers and
deliberately keeps the metrics history.
The full procedure, the by-hand equivalent, password rotation, scraping a proxy on another
host, and the panel-by-panel reading guide live in
deploy/grafana/README.md
rather than being duplicated here.
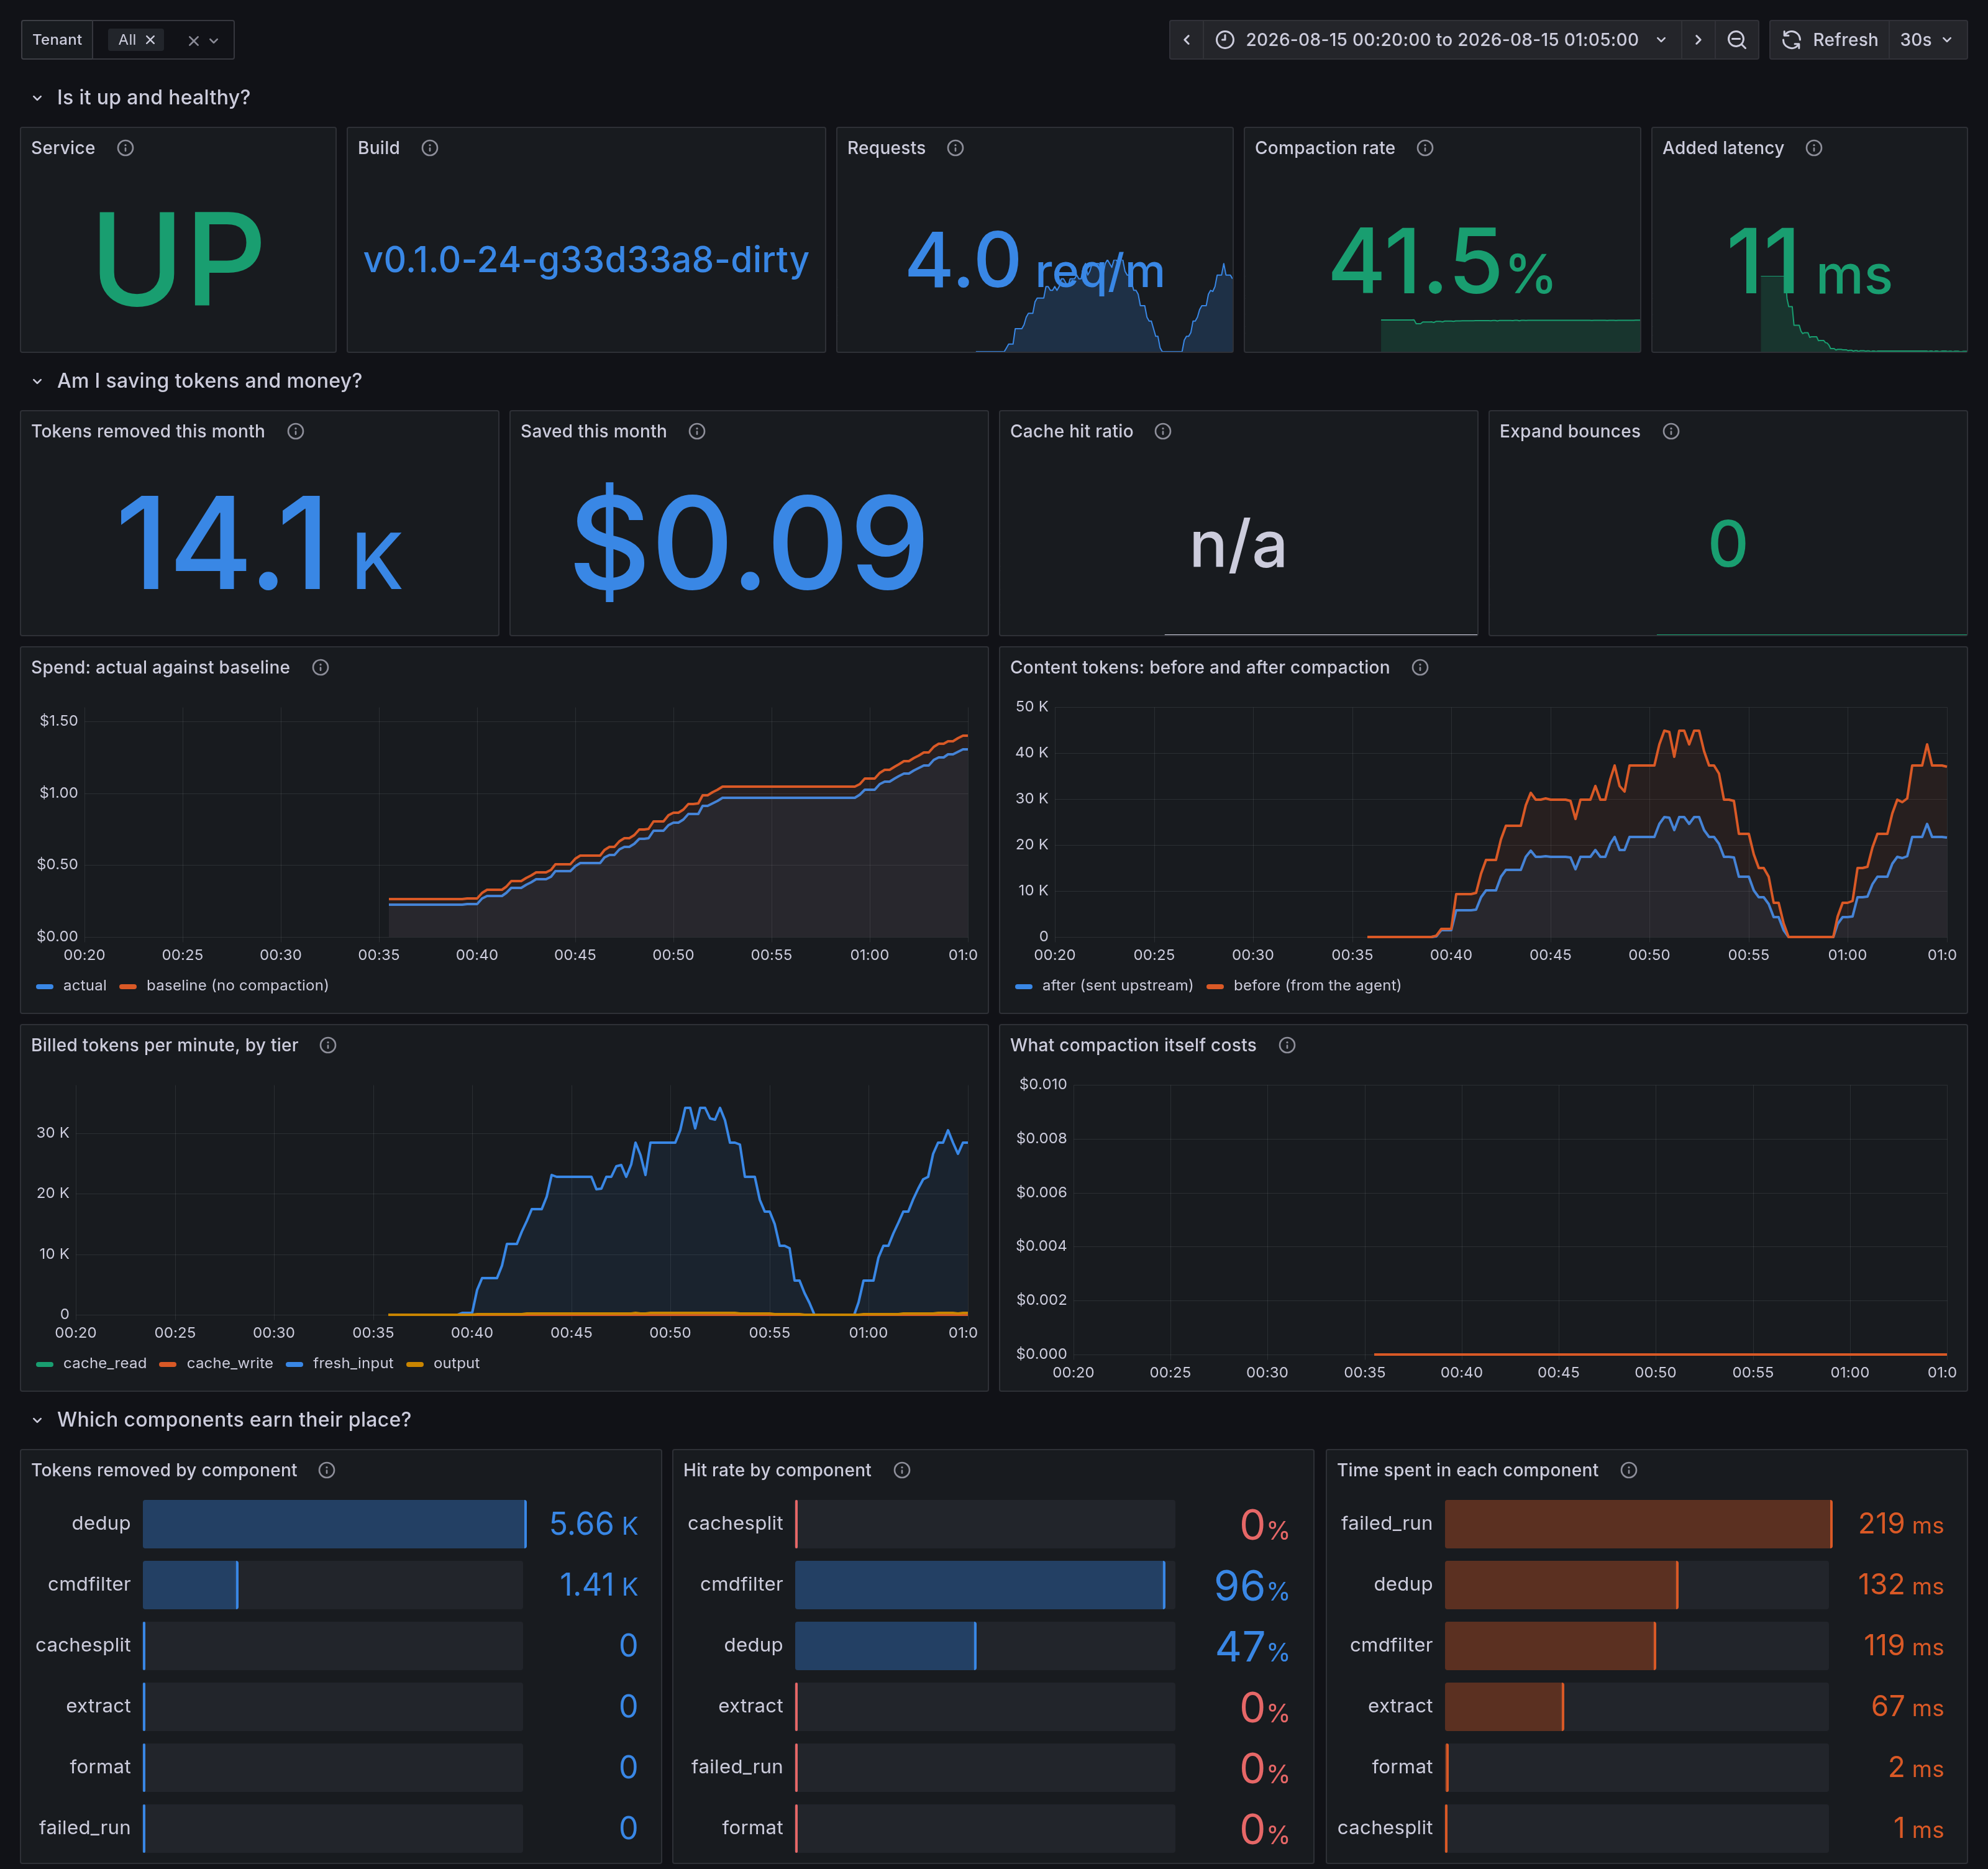
Two dashboards are provisioned, each answering a different question.
context-guru — is this thing working and paying for itself? Six rows, in the order
you would actually ask: is it up and healthy · am I saving tokens and money · which
components earn their place · who is using it · is storage healthy · is anything failing.
context-guru-slo — is the service meeting its obligations? Availability, the latency
the service is itself responsible for, whether the observability path is dropping events,
and an HTTP error-rate SLI over refused + processed (a refused request never reaches the
aggregator, so cg_requests_total alone is the wrong denominator).
Every panel carries a description saying what a bad value looks like.
Two panels that lie, and are documented as lying
Worth knowing before you read either dashboard as a verdict:
-
Cache hit ratio reads
n/a, not 0, against an upstream that reports no cache tiers in its usage block. That zero would be the upstream's silence, not a cache miss. The cost of rendering it neutral is that a genuine collapse to exactly 0 would also readn/a; the metric cannot tell the two apart, and only the upstream can fix that.Your internal gateway may still report cache tiers
Many internal LLM gateways do report
cache_creation_input_tokens,cache_read_input_tokens, and the ephemeral cache-creation split, so this deployment's tiers may well be usable even behind an internal gateway. If a panel readsn/a, suspect the streaming path or a model the pricer cannot name before suspecting the gateway.Availability, 30 daysis meaningless until Prometheus has retained 30 days.avg_over_time(up[30d])averages the samples that exist, so a Prometheus started an hour ago reports a flattering 100%.
Two panels that this dashboard corrects for, worth knowing because an older screenshot may still be in circulation:
Total avoided this monthsteps red below 0. A negative figure — compaction spending more on its own model calls than it saved — has to look negative; that tile is the one number an operator reads to decide whether to keep the thing switched on.Activity rate by componentreplaces a panel that dividedactedbyran, which paintedcachesplitas a dead red component. It is mutated-never-acted by design (the split removes no content tokens, it moves them out of the hashed prefix), so the current panel reads overoutcome="mutated", and "why did it decline?" has its own panel overcg_component_gate_declines_total.
Alert rules are provisioned — two, in
deploy/grafana/provisioning/alerting/context-guru.yml: up{job="context-guru"} == 0 for
5 minutes, and refusals above 10% of refused + processed for 15 minutes (measured live at
20.3% of requests, 92% of them rate_limit — invisible on every panel that plots only the
requests that got through). They fire into whatever notification policy the instance
already has; a contact point in version control is either a stale address or a leaked
webhook secret.
Those and the rest — what cg_refused_requests_total does not count, the per-tenant
series cap, and month-to-date series resetting at the first of the month — are in
deploy/grafana/README.md, "Known gaps".
Access. /metrics is a service-wide view that includes per-tenant cost, so in
hosted mode it is gated exactly like /stats: loopback needs nothing (Prometheus
normally runs beside the proxy), anything else needs the bearer token from
METRICS_TOKEN.
No emails in labels. Series carry the tenant id and the account's label, never the email. Metrics are typically the least access-controlled surface in an organisation, and personal data does not belong in a scrape target. There is a test asserting it.
The three numbers worth alerting on, in order:
cg_cache_hit_ratiofalling. Compaction that mutates an already-cached prefix forces a re-write at roughly 12× the read price. This moves before the bill does.cg_dash_events_total{disposition="dropped"}above zero. The capture queue filled and observability is degrading under load — exactly when it is most wanted.cg_llm_failures_total{kind="timeout"}in a run. The compaction model is silently doing nothing, so the deployment looks fast because it stopped working.
cg_archive_configured at 0 is the fourth: while it is 0, disk pressure deletes
instead of migrating. cg_extract_net_value_usd below 0 is the fifth, and the only one
denominated in money: extraction is the one component that spends, so its gross token
count can look impressive while it is underwater (measured live at −$0.7085).
Two of those are wired as provisioned Grafana rules today — service down and refusal rate,
the two failures a dashboard cannot catch because nobody is watching a screen at 03:00. The
rest are one data: block each in the same file if you want them.
Series colours in the dashboard are pinned rather than left to Grafana's classic
palette, which cycles hues and repaints the survivors when a series disappears. The
three used are validated colourblind-safe against Grafana's dark surface (worst
all-pairs CVD ΔE 9.4, normal-vision 20.9), and the meaning is consistent across
panels: blue is what actually happened, orange is the comparison to read it
against, so the gap between them is the story. No panel uses two y-axes, which is also
why Spend: actual against baseline no longer plots the prefix-split saving: at $0.03
against $2,523 of spend it was four orders of magnitude down, pinned flat on the x-axis
and readable as zero. It has its own stat tile.
Accounts, in the browser
/dashboard/ detects which world it is in by calling GET /api/whoami, which answers
200 in every case: hosted: false means this is a single-tenant proxy and every
account control stays hidden, hosted: true with authenticated: false shows the
sign-in gate, and an authenticated answer shows the dashboard — carrying the account,
its tokens and the registration mode, so the probe and the first render are one round
trip. The mode is detected rather than built in, because a compile-time flag is one more
thing to keep in step with the server.
| View | What it does |
|---|---|
| Sign in / Register | Registration takes an email, a password, a token label, and an invite code if the deployment is in invite mode; entering the mailed 6-digit code verifies the address, returns the token once, and signs you in — so registration flows straight to Setup with the token already substituted into the snippets. On a closed deployment the attempt is refused — see step 4. Signing in later is password + a fresh mailed code, and an account created before passwords existed can still sign in with its token. Either way the browser only ever holds the session cookie. |
| Setup | The three copy-paste blocks, with your own token and this deployment's real base URL (derived from the request, so it is correct behind nginx and on loopback alike). Your provider key stays where it already is; the blocks only add the base URL and the x-context-guru-token header — or, for Bob, the one-time key-binding curl. |
| Settings | Upstream per dialect, content-capture consent, month-to-date spend, bound agent keys, token management, signed-in machines, and your own configuration-change history. Mode, component toggles and the compaction fields are the manager's, per account; a plain account is told so and asks them. For a manager, they are read-only while tracking the server default, with Customise to take ownership. |
| Archive | What has moved to cold storage, from the local index. Opening one fetches it back read-only. |
| Components | Manager only on a hosted deployment, since the pipeline it exists to tune is the manager's. Still there on a single-tenant proxy, where the operator is the only user of their own box. |
| Tenants | Manager only: every account with its month-to-date spend, disable an account, reissue a lost token. |
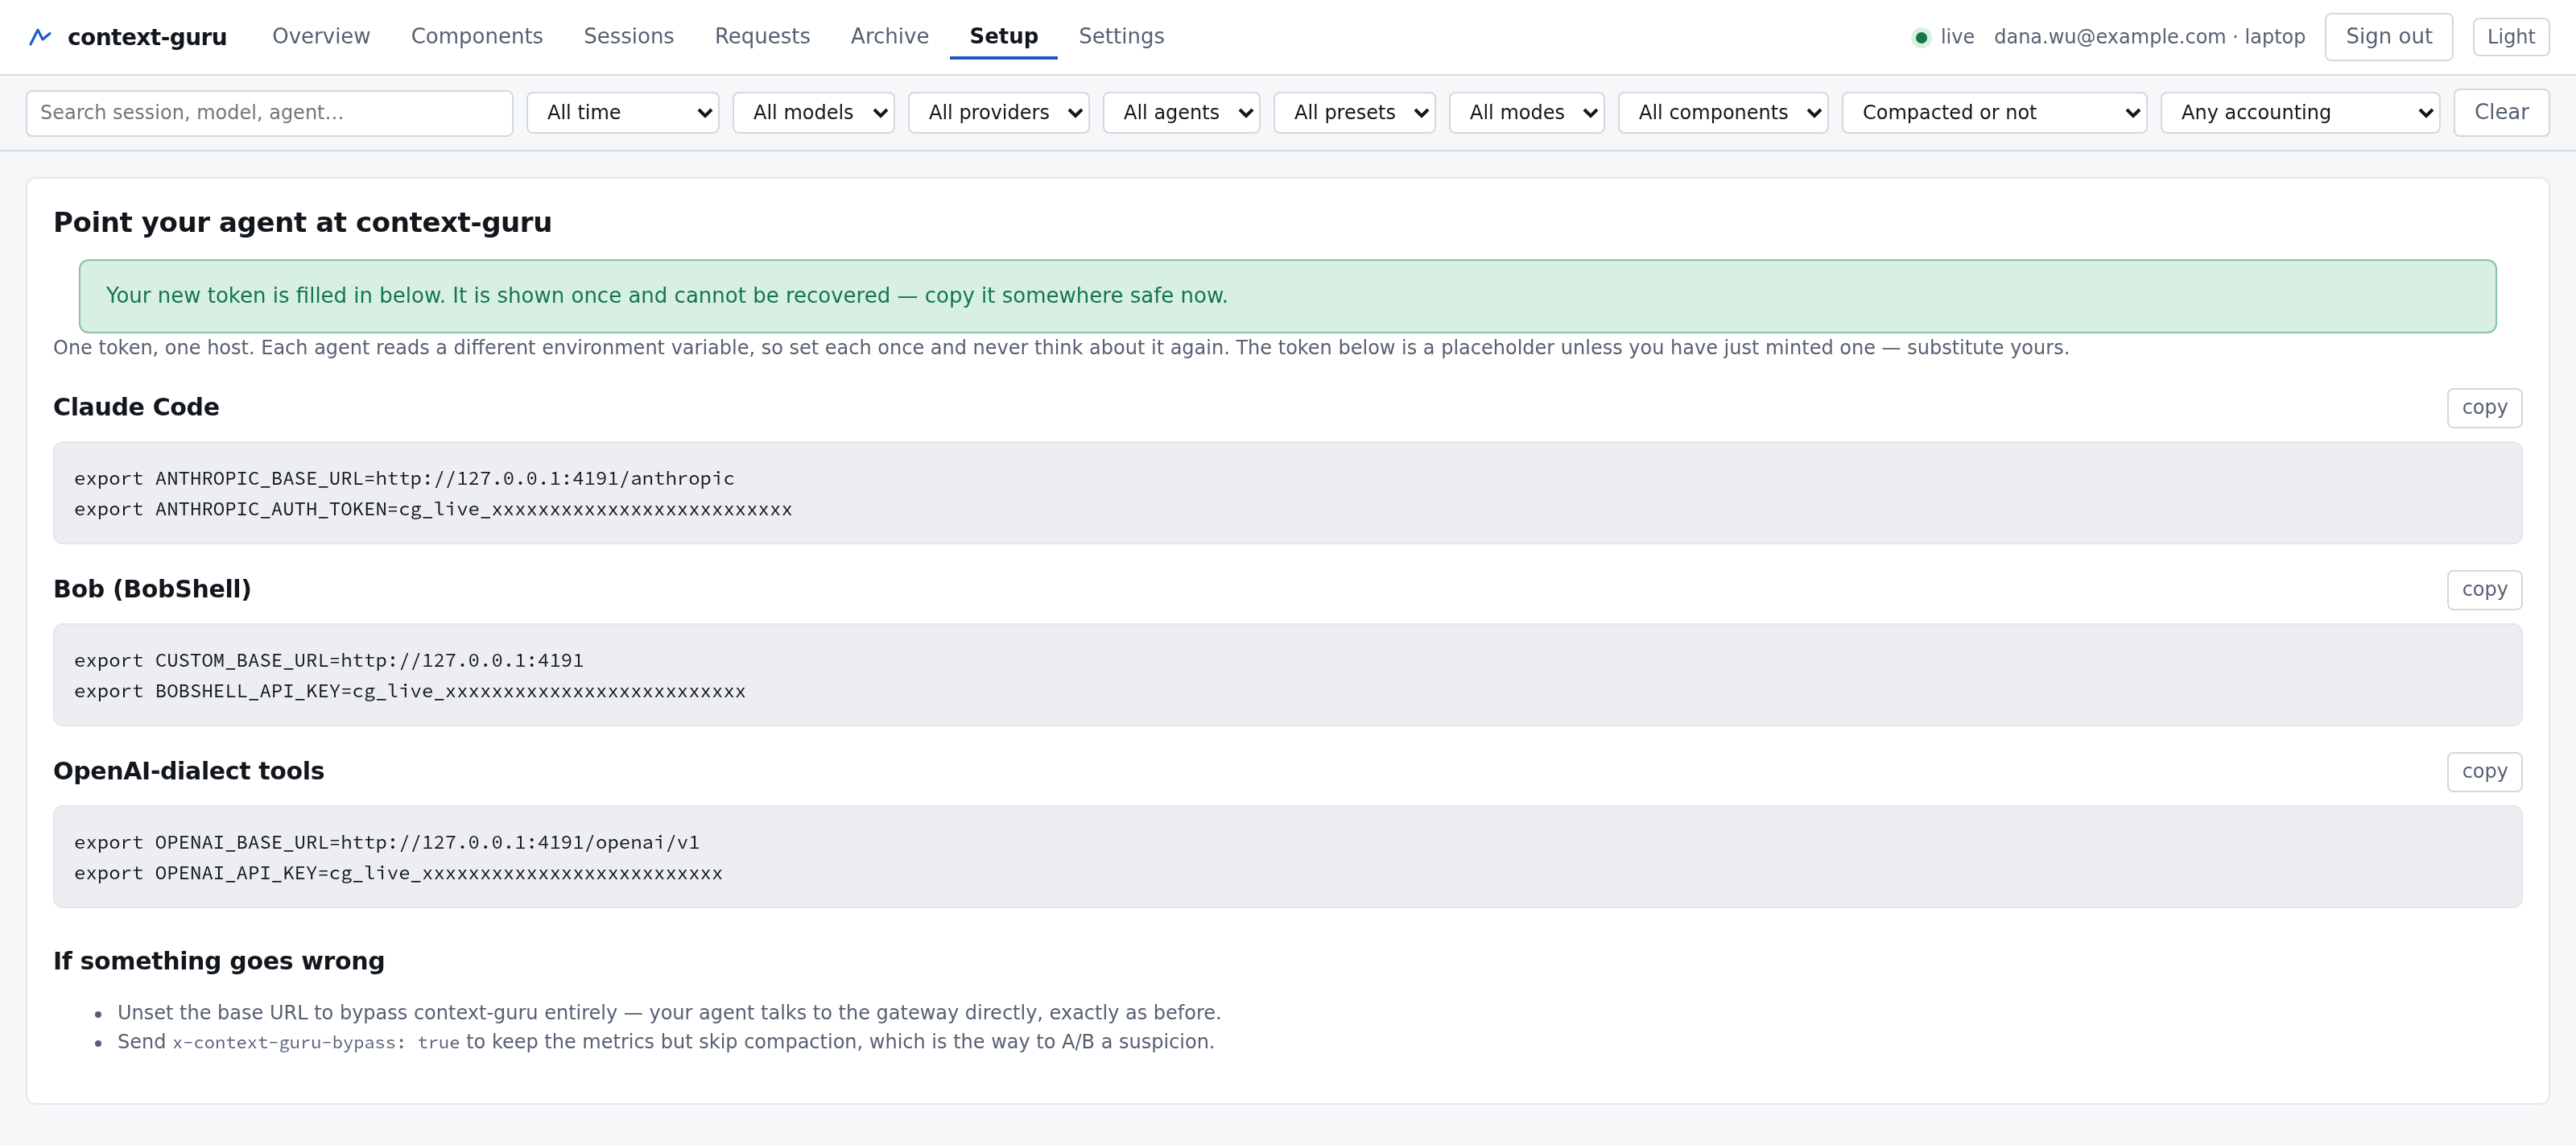
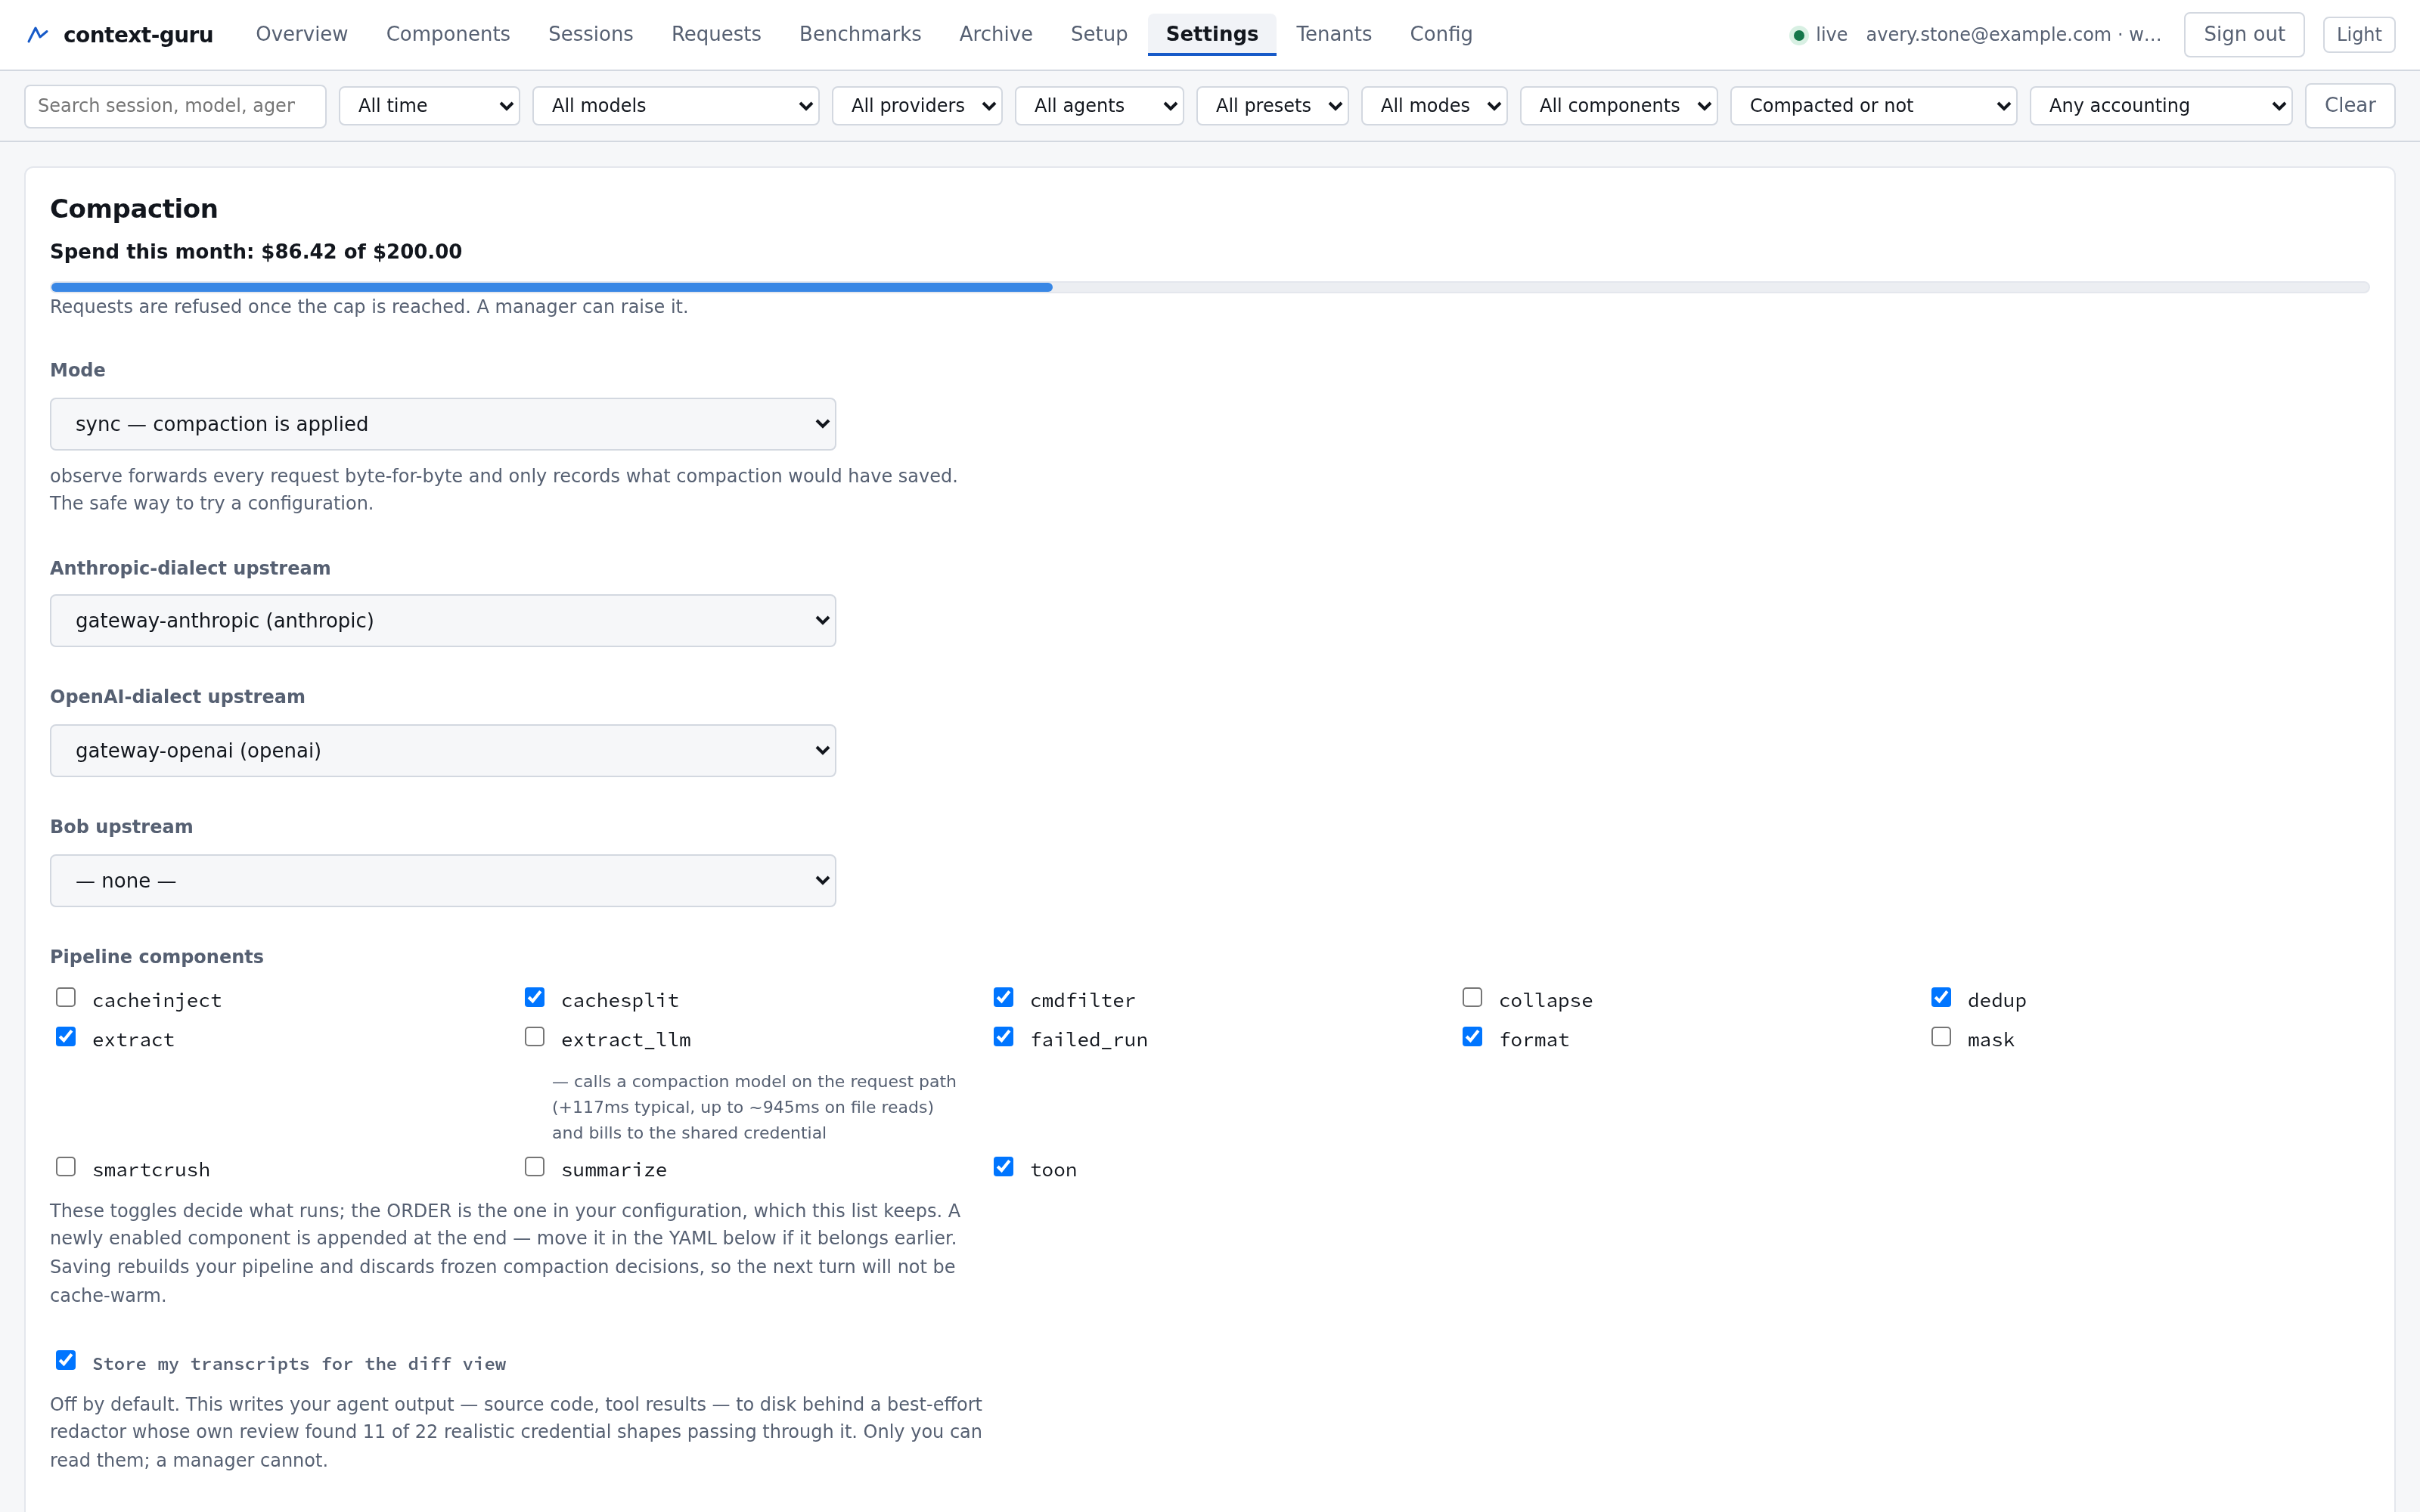
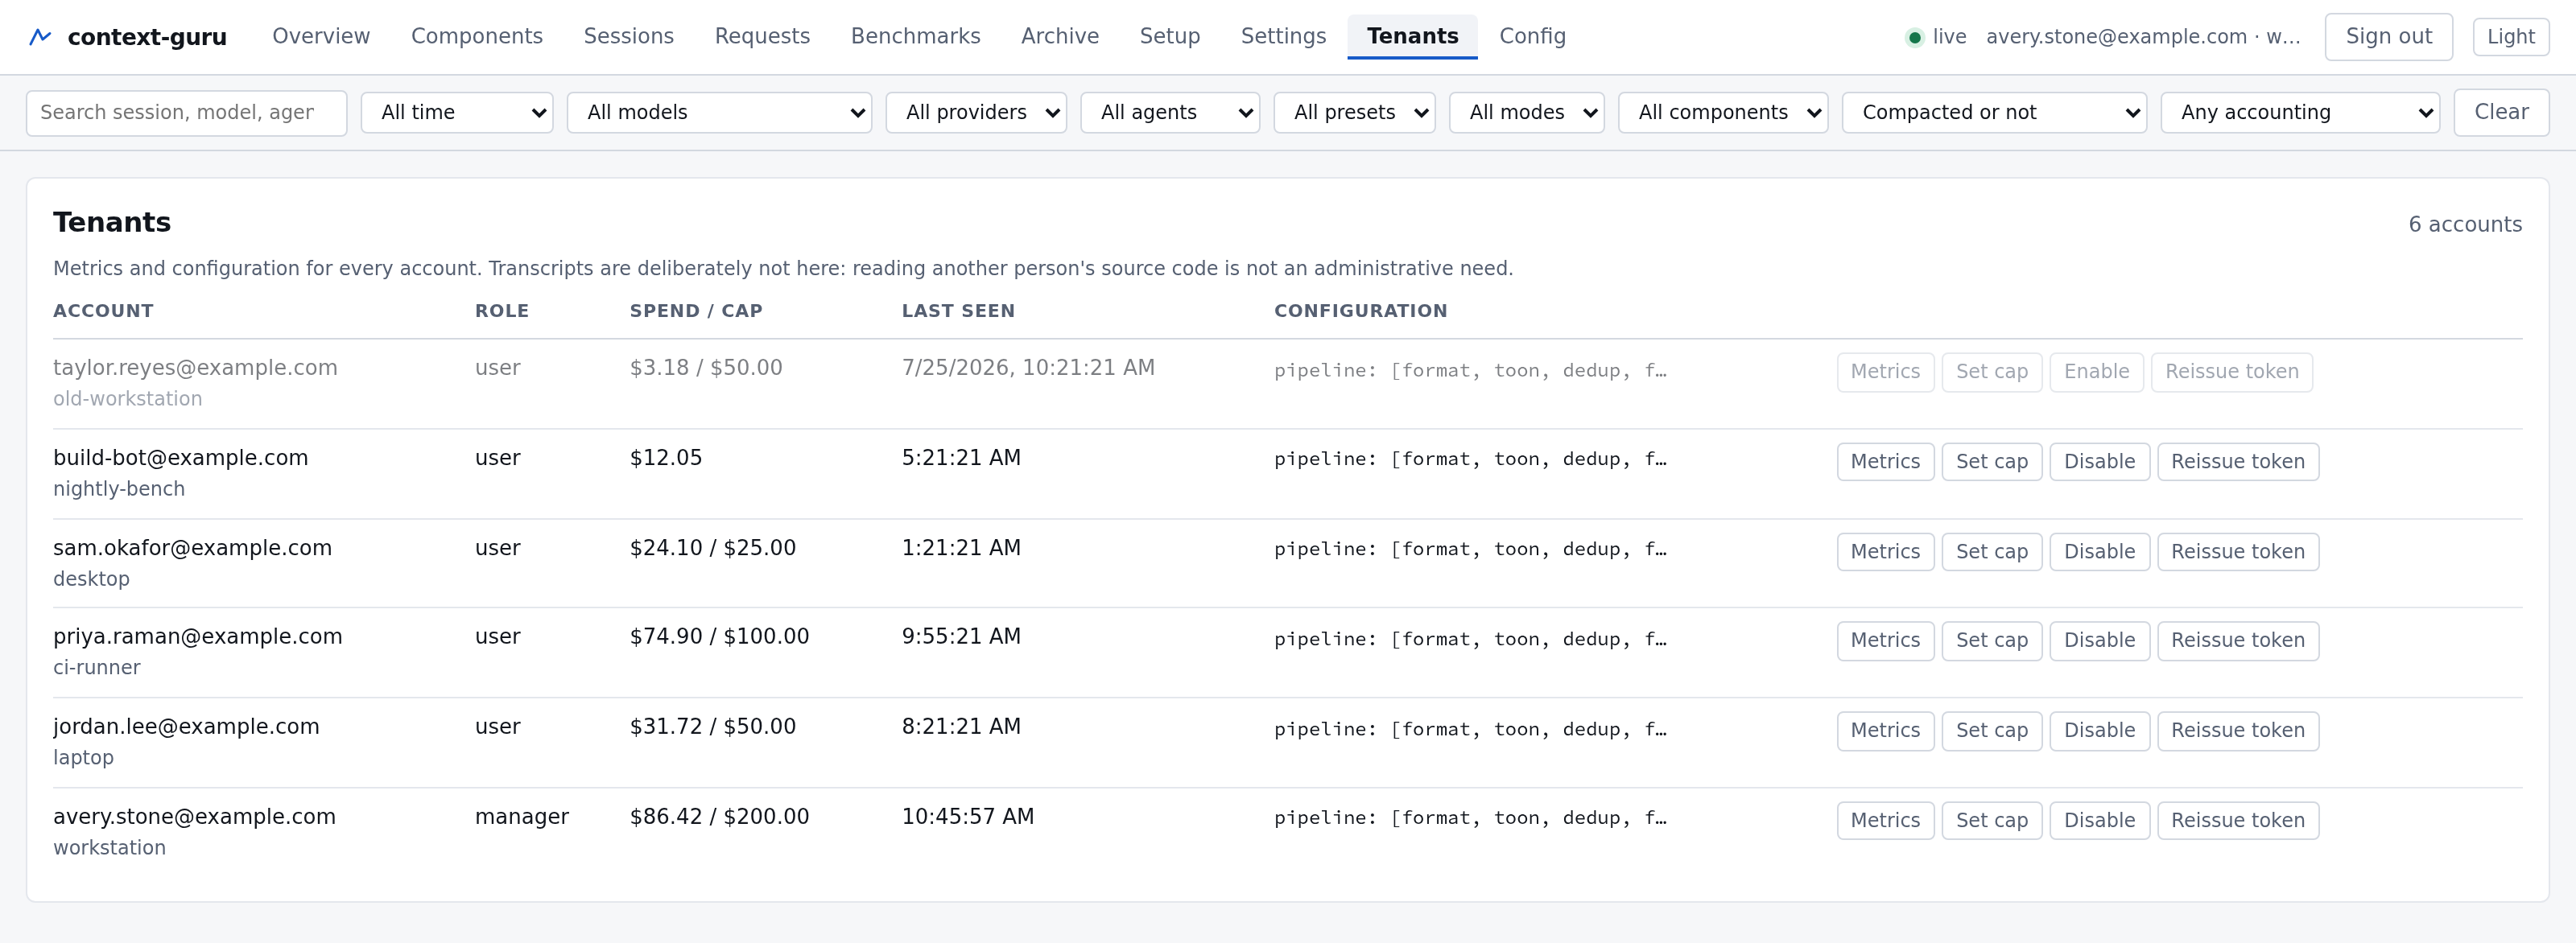
Two rules the UI enforces because the server does:
- Config edits are validated on save, and a rejected document names the offending key. A settings page that accepts what the proxy will later refuse lets someone break their own agent and not find out until they use it.
- Upstreams are a dropdown of the operator's allow-list, never a text field.
The page keeps its strict same-origin CSP, no npm, no bundler and no CDN. style-src
'self' blocks inline style attributes, which is why styling goes through the CSSOM.
Limits
| Bound | Flag | Default |
|---|---|---|
| Requests per minute, per tenant | --tenant-rpm |
0 (unlimited) |
| In-flight requests, per tenant | --tenant-concurrent |
0 (unlimited) |
| Concurrent compaction-model calls, process-wide | --cheap-model-concurrent |
4 |
The compaction-model bound is process-wide rather than per tenant on purpose: the point
is to stop one tenant's extract_llm traffic from making everyone else's agents wait on
a shared, rate-limited backend.
There is no spend cap. Each tenant's traffic is billed to the credential their own
agent sends, so there is nothing shared to ration. Cost is still recorded and displayed;
it needs MODEL_INFO on to be non-zero, and prices load asynchronously on first use, so
the very first request after a restart is recorded as partial and unpriced.
Privacy
- Transcript capture has two independent switches, and they default differently.
--dashboard-content/DASHBOARD_CONTENTis process-wide and this repository ships itfalse. The per-tenant switch behind it is created on — registration writescapture_content: true. Either one alone stops the writes, so on a stock install the operator's switch is what keeps a new account's source code off disk, and opening it starts capturing every account that has not turned its own switch off. - Whether your instance captures content is a fact about its environment, not about the
shipped default — so read it, do not assume it. A drop-in overrides the unit, so
DASHBOARD_CONTENTincontext-guru.serviceis not the effective value:systemctl show context-guru -p Environmentis. Do this before answering a user who asks whether their source code is stored, because with the per-tenant switch defaulting on, an enabled operator switch means a new account's message content — agent output, tool results, source code — is captured from its first request. Both off switches belong in the same breath as the answer: a tenant clears their own consent on Settings, an operator setsDASHBOARD_CONTENT=falsefor everyone. Neither is retroactive in either direction. The redactor in front of the write is a best-effort denylist — a review of 22 realistic credential shapes found 11 passing through it — so this is a decision about real source code landing on disk. - A manager sees everyone's metrics and everyone's transcripts. An explicit owner decision: whoever runs the service can open any account's request drawer and compaction diff via the account selector, over whatever that account consented to capture. Tell users, because it is what their consent now means; the Settings consent screen says it too. A manager may also withdraw that consent, purge what it produced and delete the account, and may start a password reset — but still cannot set a password, so a manager cannot act as a user against an upstream. See Managing users.
- Hosted mode refuses to start with
CONTEXT_GURU_DUMPorCONTEXT_GURU_CAPTUREset. Either one appends every tenant's pristine request bodies to a single process-wide file: unredacted, with no tenant column, on a path the redactor never runs. That bypasses both per-tenant capture consent and the scrubber, so the boot fails naming the variable rather than warning. Unset it, or drop--upstreamsto run single-tenant, where the hook only sees your own traffic. - Session keys are namespaced by tenant. Without that, two people running the same agent against the same repository hash to the same session id and would share one sticky offload set and one cached-prefix boundary — a cross-tenant collision arrived at by nobody doing anything wrong.
Operational notes
- This box becomes a single point of failure for everyone's agent. That is the
real cost of the design.
Restart=always, the documented escape hatch above, and the fail-open invariant are the mitigations; say it out loud to users rather than letting them discover it during an outage. - Evicting an idle tenant from the in-memory tenancy cache (
--max-tenancies, 256) costs that tenant one cold cache on its next turn. It is logged at WARN, because otherwise it shows up as an unexplained cost spike. - Changing a tenant's configuration rebuilds their pipeline and store, which discards their frozen compaction decisions. That is the honest cost of changing your own pipeline mid-session, and it is why the settings page is worth reading before clicking.
- The Box OAuth token expires. rclone refreshes it automatically while it is being
used, but a remote left idle long enough will start failing with a 500 from Box. The
fix is
rclone config reconnect box:(the colon is part of the name). The symptom in the log is a run ofarchiving failedwarnings with the local copies intact — no data is at risk, but disk stops being reclaimed, so it is worth alerting on. - Watch
ARCHIVE_BWLIMIT. rclone will use every bit of upload bandwidth it can get, and this box also carries everybody's agent traffic. The unit ships 8M; measure the real uplink before raising it, and remember--bwlimitis in bytes per second while speed tests report bits. - Archiving is a background trickle against a rate-limited API: one object per session,
serialised, at most
--archive-batch(50) per pass every 15 minutes. A large backlog drains over hours rather than minutes, by design.